Fig. 5
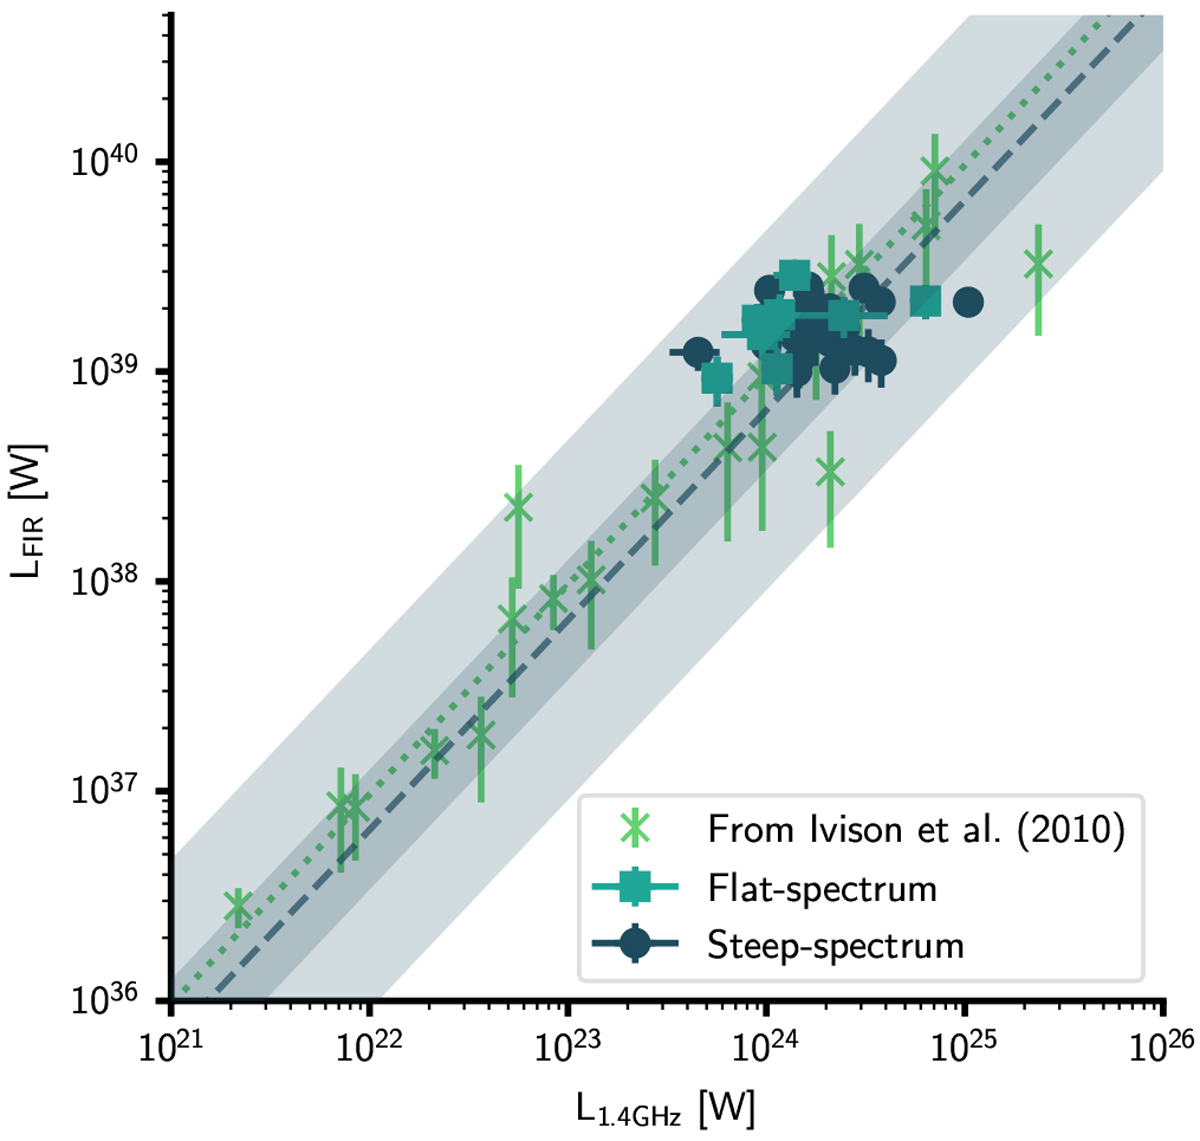
Far-infrared to radio correlation. Sources in our sample with extremely flat low-frequency radio spectral indices are plotted with light-coloured squares, and the positions of the ‘normal’ sources are plotted with dark circles. The FIRC relation calculated from our data following Eq. (1) is plotted as a dark dashed line, while the shaded region shows the 1σ and 3σ variances, respectively. Data from Ivison et al. (2010) are plotted in green crosses for comparison, with the FIRC from that work plotted as a dotted green line.
Current usage metrics show cumulative count of Article Views (full-text article views including HTML views, PDF and ePub downloads, according to the available data) and Abstracts Views on Vision4Press platform.
Data correspond to usage on the plateform after 2015. The current usage metrics is available 48-96 hours after online publication and is updated daily on week days.
Initial download of the metrics may take a while.