Fig. 4
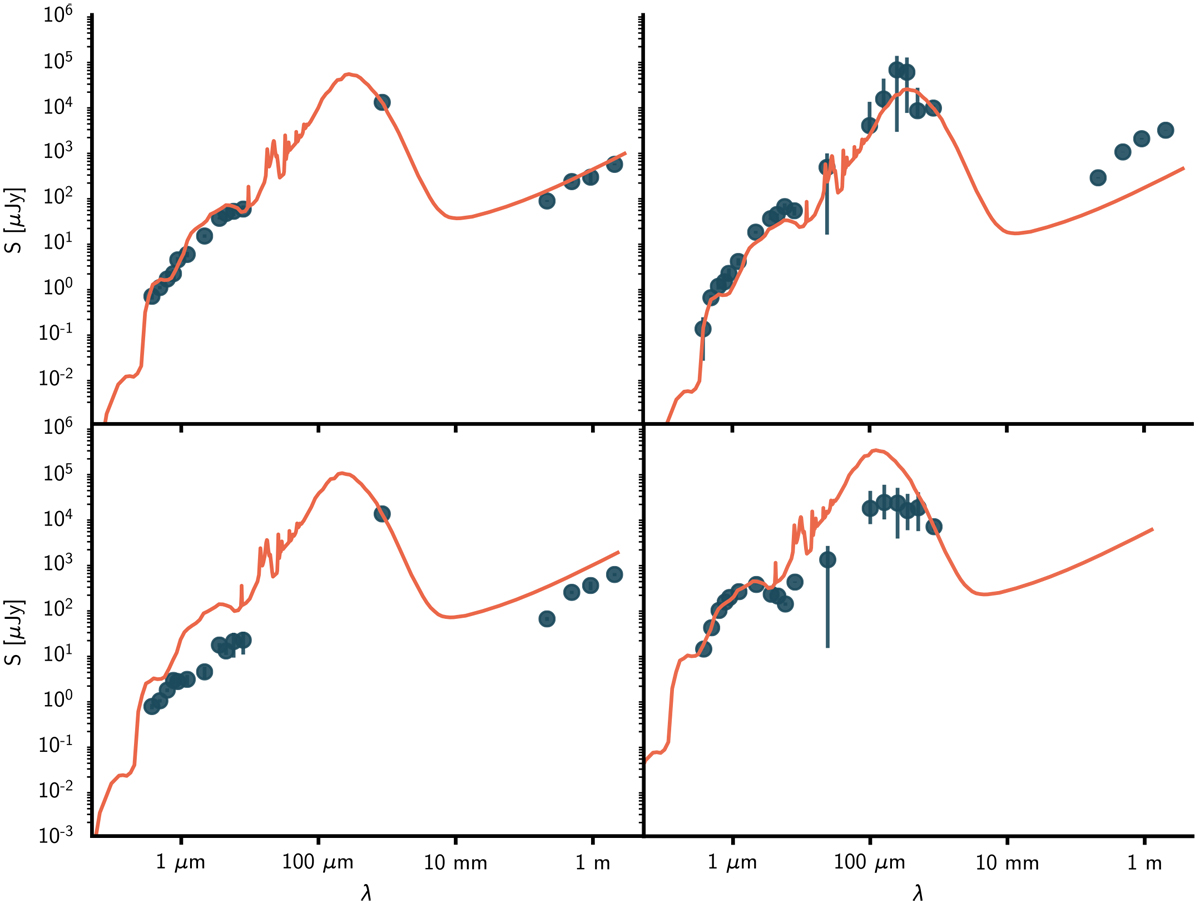
Observed-frame SEDs of four example sources from our sample. Blue points show the flux densities across the spectrum, with radio flux densities measured as described in Sect. 3.2 and optical–FIR from the LOFAR catalogue. Uncertainties are plotted, though in many cases they are smaller than the size of the plotted points. The average SMG template from Michałowski et al. (2010) (orange) is over-plotted, normalised at the observed-frame 850 μm SCUBA-2 data point. We show several examples to demonstrate that, in most cases, the template traces the IR dust spectrum well (though in others, less well) but that due to the lack of Herschel data covering the peak of the dust spectrum in several sources, we use this normalised template to estimate FIR luminosities instead of template fitting.
Current usage metrics show cumulative count of Article Views (full-text article views including HTML views, PDF and ePub downloads, according to the available data) and Abstracts Views on Vision4Press platform.
Data correspond to usage on the plateform after 2015. The current usage metrics is available 48-96 hours after online publication and is updated daily on week days.
Initial download of the metrics may take a while.