Fig. 7.
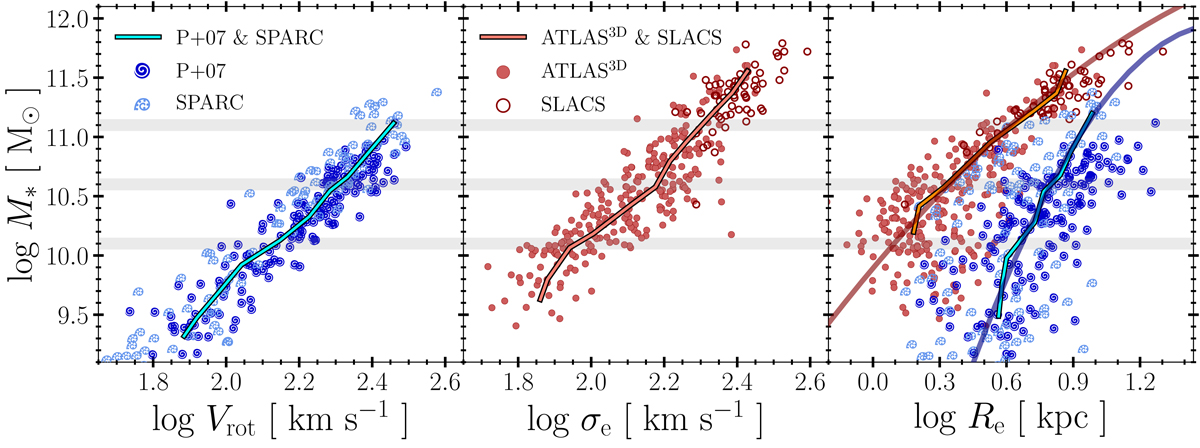
Correlations between the stellar mass of galaxies in our observational sample and disc rotation speed at the stellar half-mass radius (disc galaxies from SPARC and P+07, left-hand panel); line-of-sight velocity dispersion, averaged within the stellar half-mass radius (ellipticals from ATLAS3D and SLACS; middle panel); and effective radius (all galaxies; right-hand panel). Circles denote ellipticals, spiral symbols denote discs. The thick wiggly curves indicate the median trend, computed in bins of stellar mass. The smooth coloured curves in the right-hand panel indicate fits to the average trends.
Current usage metrics show cumulative count of Article Views (full-text article views including HTML views, PDF and ePub downloads, according to the available data) and Abstracts Views on Vision4Press platform.
Data correspond to usage on the plateform after 2015. The current usage metrics is available 48-96 hours after online publication and is updated daily on week days.
Initial download of the metrics may take a while.