Fig. 6.
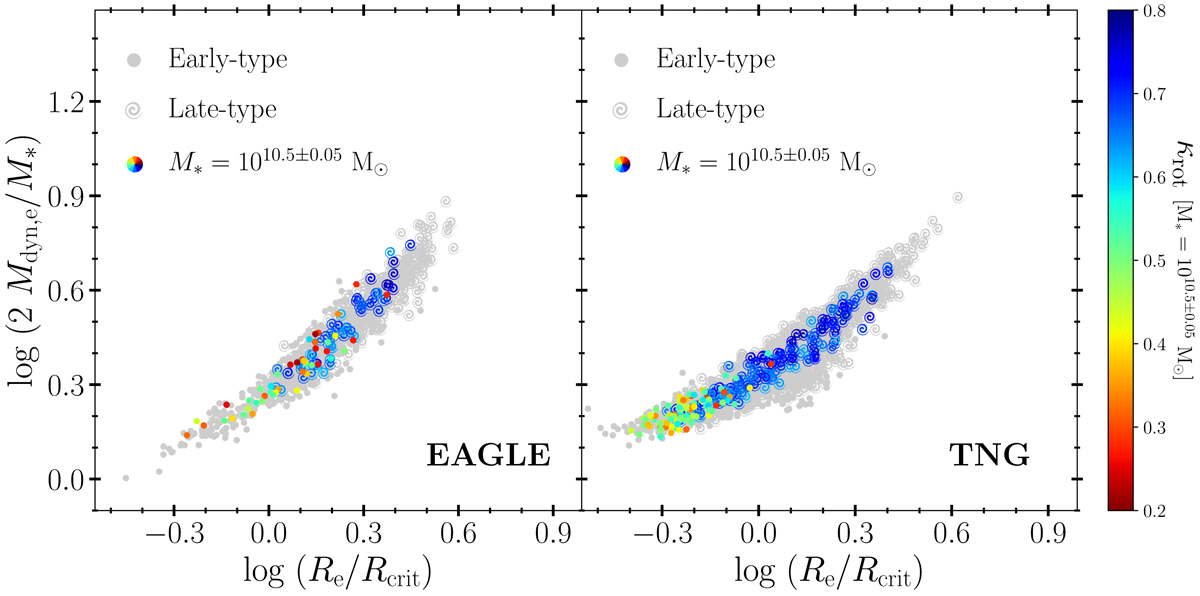
‘Dynamical mass-to-light ratio’, ![]() , as a function of galaxy effective radius, expressed in units of the ‘critical’ radius introduced in Fig. 4, for EAGLE (left-hand panel) and TNG (right-hand panel). Grey symbols represent all simulated galaxies, while those highlighted in colour correspond to galaxies with stellar masses M* = 1010.5 ± 0.05 M⊙ (i.e. those in the second grey band, from bottom to top, in Fig. 2). Galaxies in that mass bin are coloured according to κrot, going from slow- (red) to fast-rotator galaxies (blue). It is clear that the dynamical mass-to-light ratio, which measures a galaxy’s dark matter content, is an increasing function of Re/Rcrit. This suggests that galaxy size is a primary cause of the tilt of the FP.
, as a function of galaxy effective radius, expressed in units of the ‘critical’ radius introduced in Fig. 4, for EAGLE (left-hand panel) and TNG (right-hand panel). Grey symbols represent all simulated galaxies, while those highlighted in colour correspond to galaxies with stellar masses M* = 1010.5 ± 0.05 M⊙ (i.e. those in the second grey band, from bottom to top, in Fig. 2). Galaxies in that mass bin are coloured according to κrot, going from slow- (red) to fast-rotator galaxies (blue). It is clear that the dynamical mass-to-light ratio, which measures a galaxy’s dark matter content, is an increasing function of Re/Rcrit. This suggests that galaxy size is a primary cause of the tilt of the FP.
Current usage metrics show cumulative count of Article Views (full-text article views including HTML views, PDF and ePub downloads, according to the available data) and Abstracts Views on Vision4Press platform.
Data correspond to usage on the plateform after 2015. The current usage metrics is available 48-96 hours after online publication and is updated daily on week days.
Initial download of the metrics may take a while.