Fig. 5.
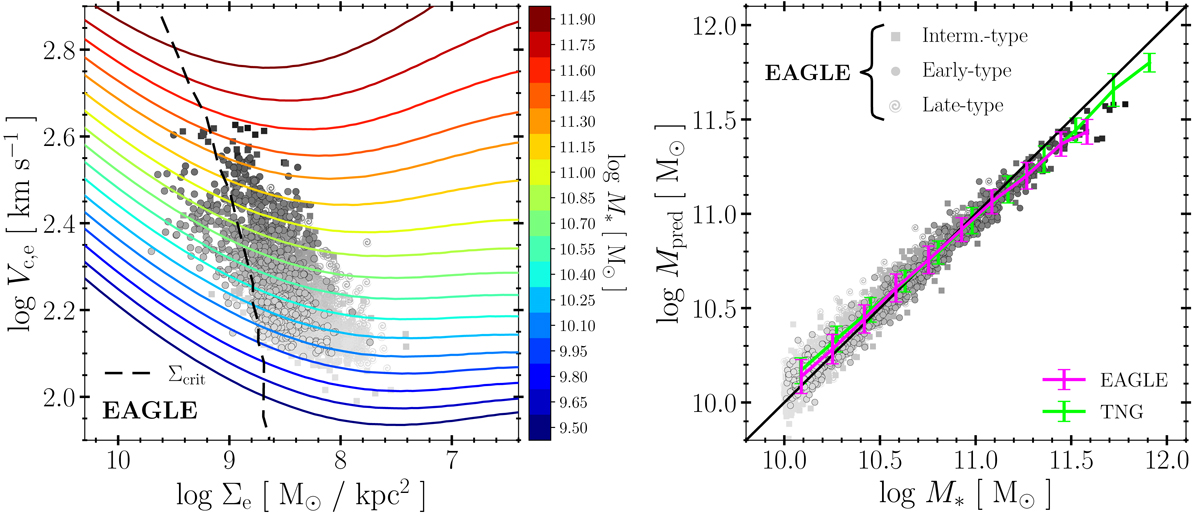
Procedure to use the model as a secondary distance indicator. Left: grid of constant M* model curves linking Vc, e and the mean stellar surface density (brightness) within the effective radius, ![]() (axis are inverted). Each curve is computed using the fiducial model described in Sect. 3.3, using the EAGLE M* − M200 relation (see the left-hand panel of Fig. 2). Galaxy stellar masses may be interpolated using this grid for all galaxies, regardless of morphological type. All EAGLE galaxies are shown shaded in grey according to stellar mass; circles for early-types, spirals for late types, and squares for the rest. Right: galaxy stellar masses predicted from the location of simulated galaxies in the Vc, e − Σe plane on the left as a function of their true stellar mass. Is remarkable the excellent agreement and the rather small scatter around the median trend, shown by the magenta solid line (error bars indicate 25–75 percentile range). Results of the same fiducial model, applied to the TNG dataset are shown by the thick green line (data for individual TNG galaxies not shown, for clarity). The good agreement suggests that the location of a galaxy in the Vc, e − Σe plane can be effectively used as a powerful secondary distance indicator applicable to galaxies of all morphological types.
(axis are inverted). Each curve is computed using the fiducial model described in Sect. 3.3, using the EAGLE M* − M200 relation (see the left-hand panel of Fig. 2). Galaxy stellar masses may be interpolated using this grid for all galaxies, regardless of morphological type. All EAGLE galaxies are shown shaded in grey according to stellar mass; circles for early-types, spirals for late types, and squares for the rest. Right: galaxy stellar masses predicted from the location of simulated galaxies in the Vc, e − Σe plane on the left as a function of their true stellar mass. Is remarkable the excellent agreement and the rather small scatter around the median trend, shown by the magenta solid line (error bars indicate 25–75 percentile range). Results of the same fiducial model, applied to the TNG dataset are shown by the thick green line (data for individual TNG galaxies not shown, for clarity). The good agreement suggests that the location of a galaxy in the Vc, e − Σe plane can be effectively used as a powerful secondary distance indicator applicable to galaxies of all morphological types.
Current usage metrics show cumulative count of Article Views (full-text article views including HTML views, PDF and ePub downloads, according to the available data) and Abstracts Views on Vision4Press platform.
Data correspond to usage on the plateform after 2015. The current usage metrics is available 48-96 hours after online publication and is updated daily on week days.
Initial download of the metrics may take a while.