Fig. 3.
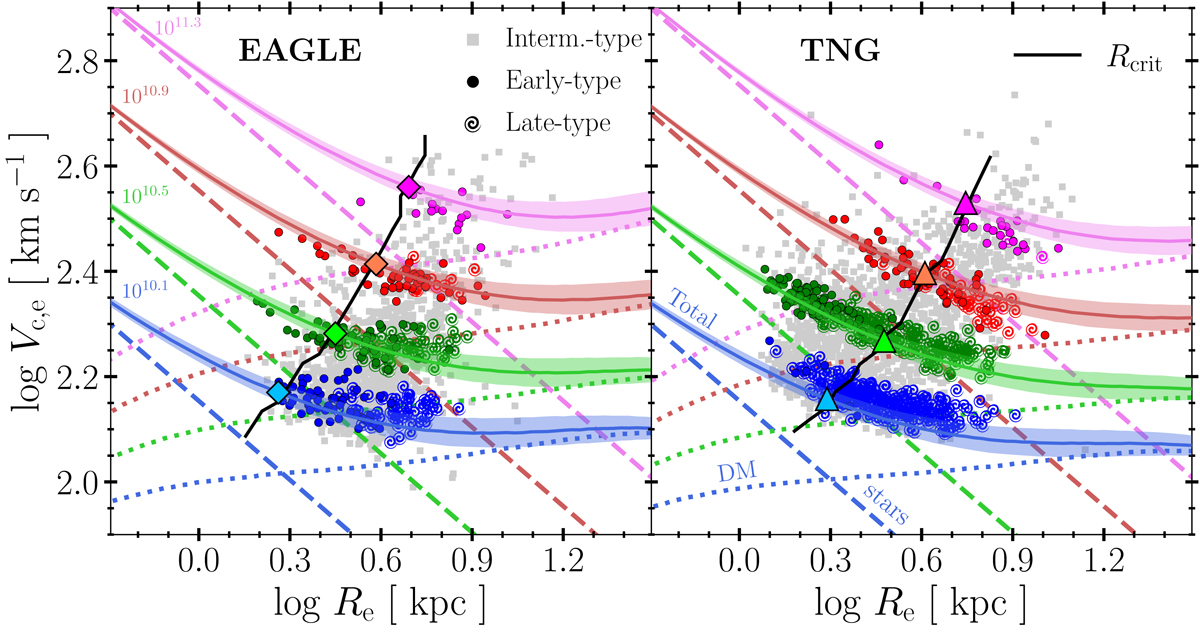
Circular velocity at the stellar half-mass radius, Vc, e, as a function of the effective radius, Re, for EAGLE (left-hand panel) and TNG (right-hand panel) simulated galaxies. All galaxies are shown in grey; those in four thin bins of stellar mass are highlighted in colour (see the grey bands in Fig. 2). Median stellar masses for each bin are listed in the legend. Circles indicate early-type (E) galaxies, spirals denote late-type (S). Slanted dashed lines indicate the expected loci of galaxies that are fully dominated by their stellar component, that is, ![]() . Dotted curves indicate the dark matter contribution expected for NFW halos with virial masses taken from the M* − M200 relation of each simulation (see, for example open symbols in Fig. 2), contracted following the procedure of Gnedin et al. (2004). Coloured lines correspond to adding in quadrature the dashed and dotted lines; error bands correspond to varying the NFW concentration about the average by ±0.09 dex. The coloured symbols (diamonds for EAGLE, triangles for TNG) indicate the ‘critical radius’ for each stellar mass bin, defined as the galaxy radius for which the enclosed mass within re is split equally between dark matter and stars. See further discussion in the text.
. Dotted curves indicate the dark matter contribution expected for NFW halos with virial masses taken from the M* − M200 relation of each simulation (see, for example open symbols in Fig. 2), contracted following the procedure of Gnedin et al. (2004). Coloured lines correspond to adding in quadrature the dashed and dotted lines; error bands correspond to varying the NFW concentration about the average by ±0.09 dex. The coloured symbols (diamonds for EAGLE, triangles for TNG) indicate the ‘critical radius’ for each stellar mass bin, defined as the galaxy radius for which the enclosed mass within re is split equally between dark matter and stars. See further discussion in the text.
Current usage metrics show cumulative count of Article Views (full-text article views including HTML views, PDF and ePub downloads, according to the available data) and Abstracts Views on Vision4Press platform.
Data correspond to usage on the plateform after 2015. The current usage metrics is available 48-96 hours after online publication and is updated daily on week days.
Initial download of the metrics may take a while.