Fig. 2.
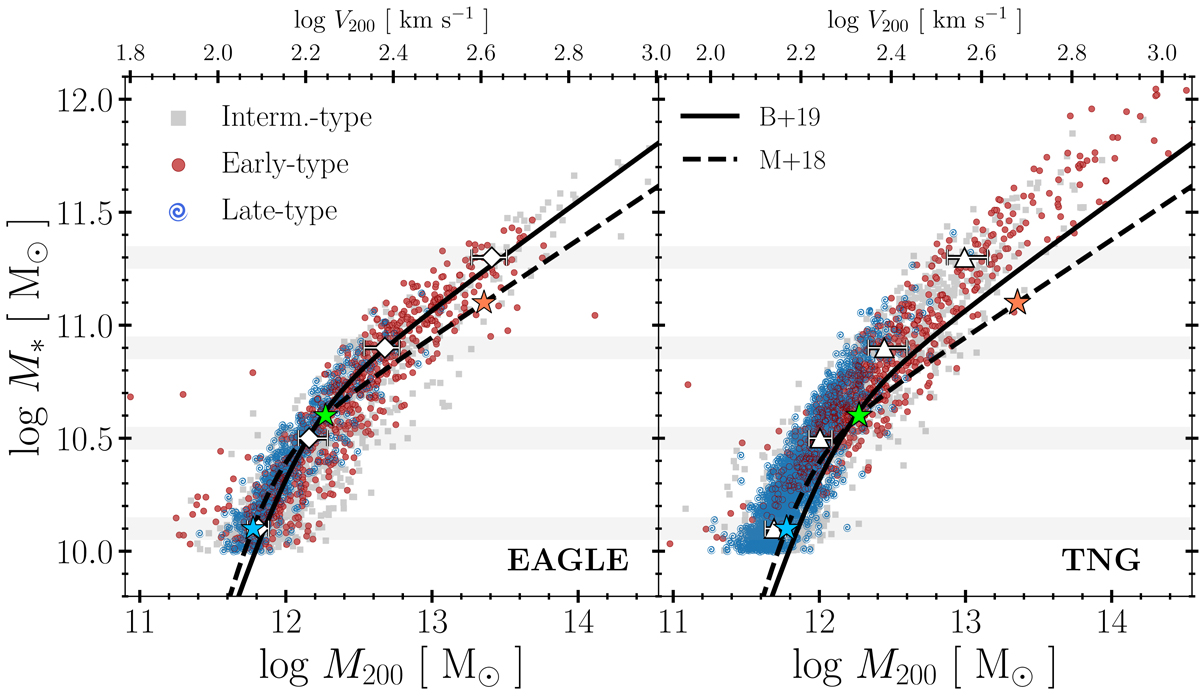
Galaxy stellar mass versus halo virial mass relation. Bottom axes indicate M200 in M⊙; top axes indicate virial velocity, V200, in km s−1. The left-hand panel corresponds to EAGLE, right-hand panel to TNG. Symbols show individual galaxies coloured by morphology: red circles indicate early-type (E); blue spiral symbols denote late-type (S); and grey squares are used for all others. Solid and dashed thick black curves indicate, for reference, the results of abundance-matching models from Behroozi et al. (2019) and Moster et al. (2018), respectively. Open symbols (diamonds for EAGLE, triangles for TNG) indicate median M200 values in the four bins of M* highlighted by the grey horizontal bands (these are used for the model curves shown in Fig. 3). ‘Error bars’ in each symbol denotes the 25–75 percentile range in each bin. Starred coloured symbols correspond to halo masses used for the models discussed in Fig. 9.
Current usage metrics show cumulative count of Article Views (full-text article views including HTML views, PDF and ePub downloads, according to the available data) and Abstracts Views on Vision4Press platform.
Data correspond to usage on the plateform after 2015. The current usage metrics is available 48-96 hours after online publication and is updated daily on week days.
Initial download of the metrics may take a while.