Fig. 12.
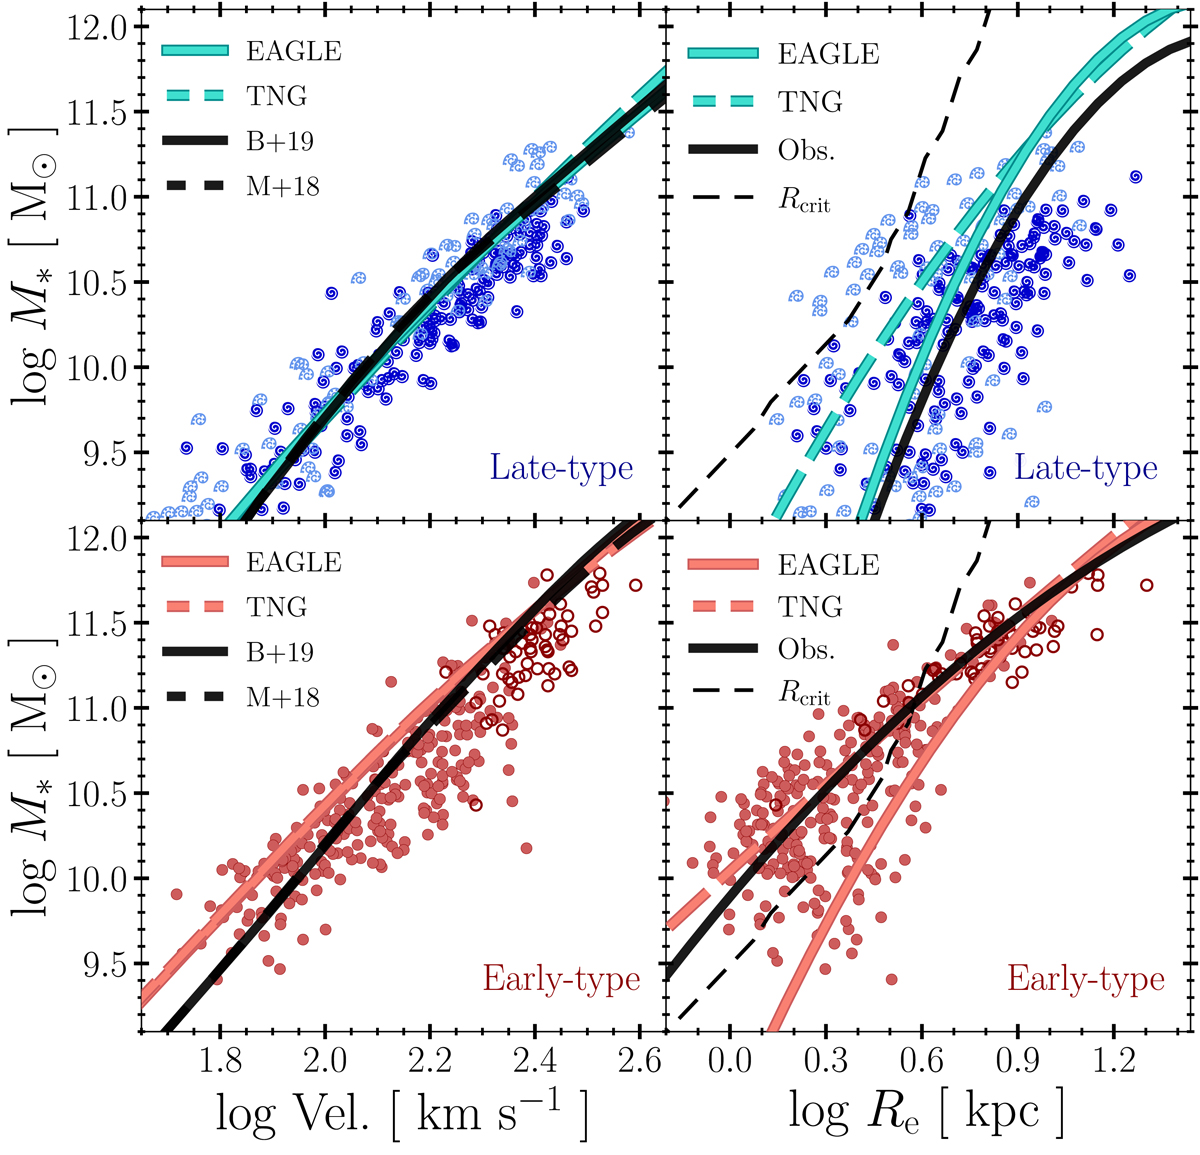
Comparison of observed and simulated galaxy scaling laws. Top row corresponds to late-type systems; bottom row to early types. In each panel, symbols denote observed galaxies. The smooth coloured lines represent the median trend of the simulation results, as in Fig. 1. It should be noted that simulations match reasonably well the rotation velocity-stellar mass (TFR; top left-hand panel). The bottom left-hand panel shows line-of-sight velocity dispersions for E galaxies versus stellar mass (FJR). Simulated galaxies have systematically lower (∼0.1 dex) velocities than observed ellipticals. Thick black lines correspond to the fiducial model applied to the hypothetical simulation discussed in Sect. 4.5. The thin black line in the right-hand panels indicate the ‘critical’ radius as a function of M* for the hypothetical simulation. See the discussion in text.
Current usage metrics show cumulative count of Article Views (full-text article views including HTML views, PDF and ePub downloads, according to the available data) and Abstracts Views on Vision4Press platform.
Data correspond to usage on the plateform after 2015. The current usage metrics is available 48-96 hours after online publication and is updated daily on week days.
Initial download of the metrics may take a while.