Fig. 11.
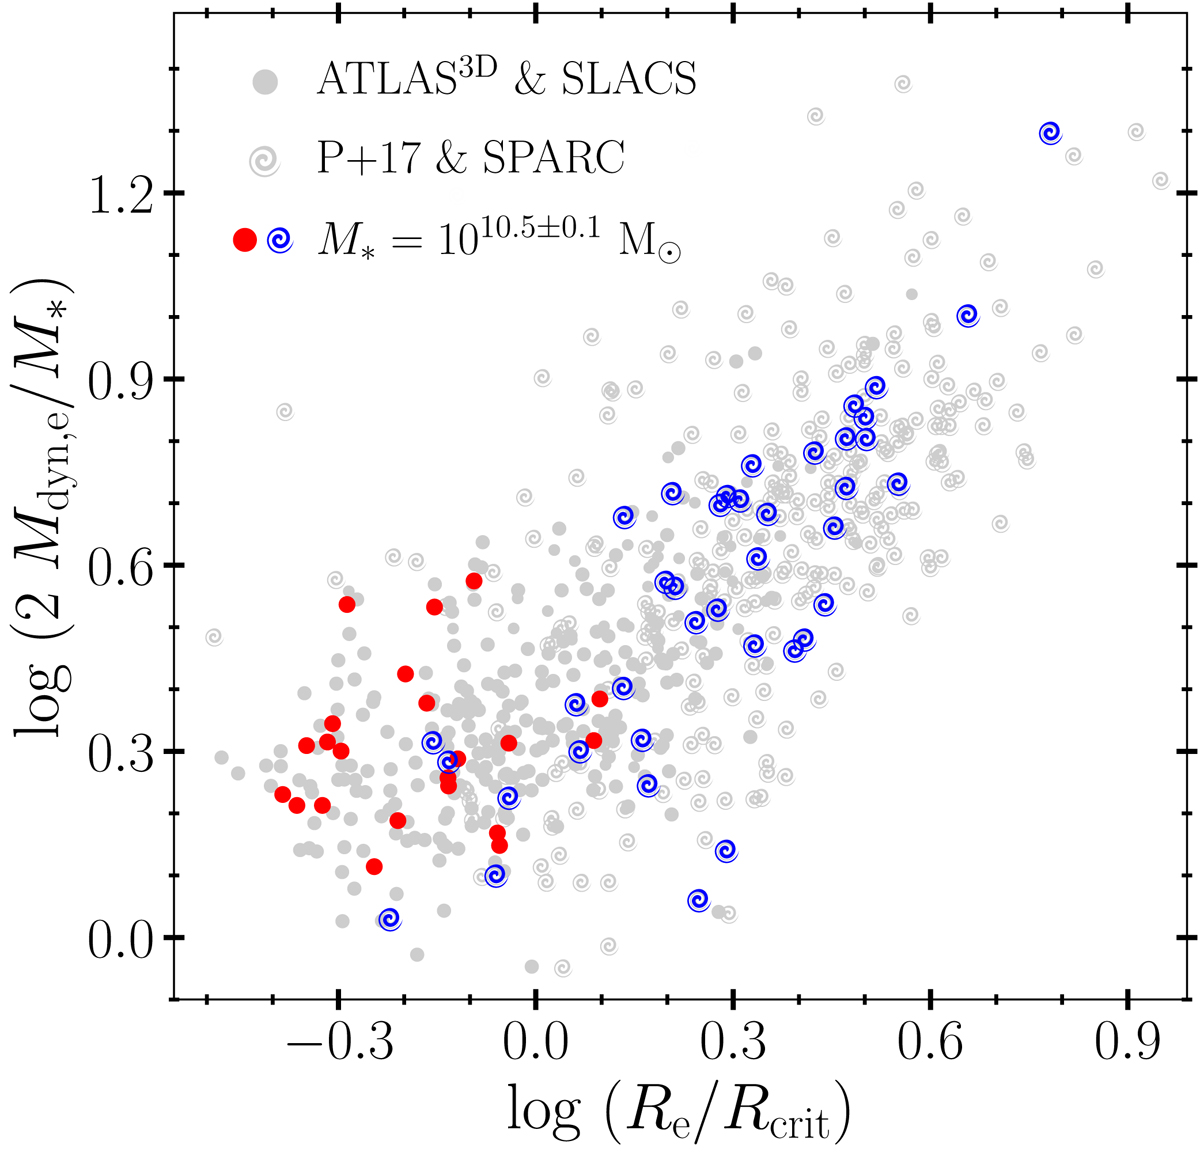
Same as Fig. 6, but for observed galaxies in our sample. Critical radii are computed as a function of M* using our fiducial model and the M+18 M* − M200 relation. Grey symbols denote all observed galaxies in our analysis while red and blue correspond to S and E galaxies, respectively, with stellar masses M* = 1010.5 ± 0.1 M⊙. It should be noted that the dynamical mass-to-light ratio increases with increasing galaxy size, at fixed M*. The mass-to-light ratio ratios also increase, in general, with increasing galaxy stellar mass because massive ellipticals tend to have larger values of Re/Rcrit than less massive early-type systems. As for simulated ellipticals, the ‘tilt’ of the FP appears correlate strongly with galaxy size.
Current usage metrics show cumulative count of Article Views (full-text article views including HTML views, PDF and ePub downloads, according to the available data) and Abstracts Views on Vision4Press platform.
Data correspond to usage on the plateform after 2015. The current usage metrics is available 48-96 hours after online publication and is updated daily on week days.
Initial download of the metrics may take a while.