Fig. 10.
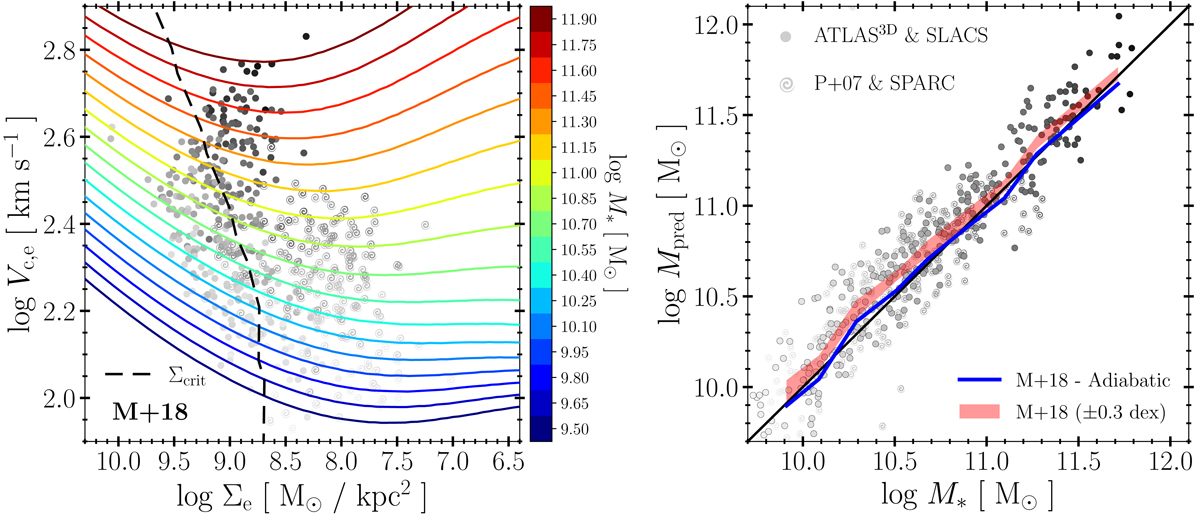
Same as Fig. 5, but for our observed galaxy sample. The panel on the left shows the grid of stellar mass models computed using the fiducial model described in Sect. 3.4, assuming the M+18 abundance-matching M* − M200 relation. Line colours indicate stellar mass, as indicated in the colour bar. Observed galaxies are shown by symbols in shades of grey, according to their stellar mass. Circles are used for early-types; spiral symbols for late types. Interpolation on this model grid allows stellar masses to be ‘predicted’ solely from the location of a galaxy in the Vc, e − Σe plane. The predicted values of M* are shown as a function of the true values of M* in the right-hand panel. The median trend is shown by the thick pink line, with an ‘error band’ that spans the change in the median predicted values after varying the M* − M200 relation by a factor of two in halo mass above and below the M+18 relation. The blue curve shows the median trend, but for a model that includes ‘adiabatic’ contraction instead of the Gnedin et al. (2004) contraction model.
Current usage metrics show cumulative count of Article Views (full-text article views including HTML views, PDF and ePub downloads, according to the available data) and Abstracts Views on Vision4Press platform.
Data correspond to usage on the plateform after 2015. The current usage metrics is available 48-96 hours after online publication and is updated daily on week days.
Initial download of the metrics may take a while.