Fig. 1.
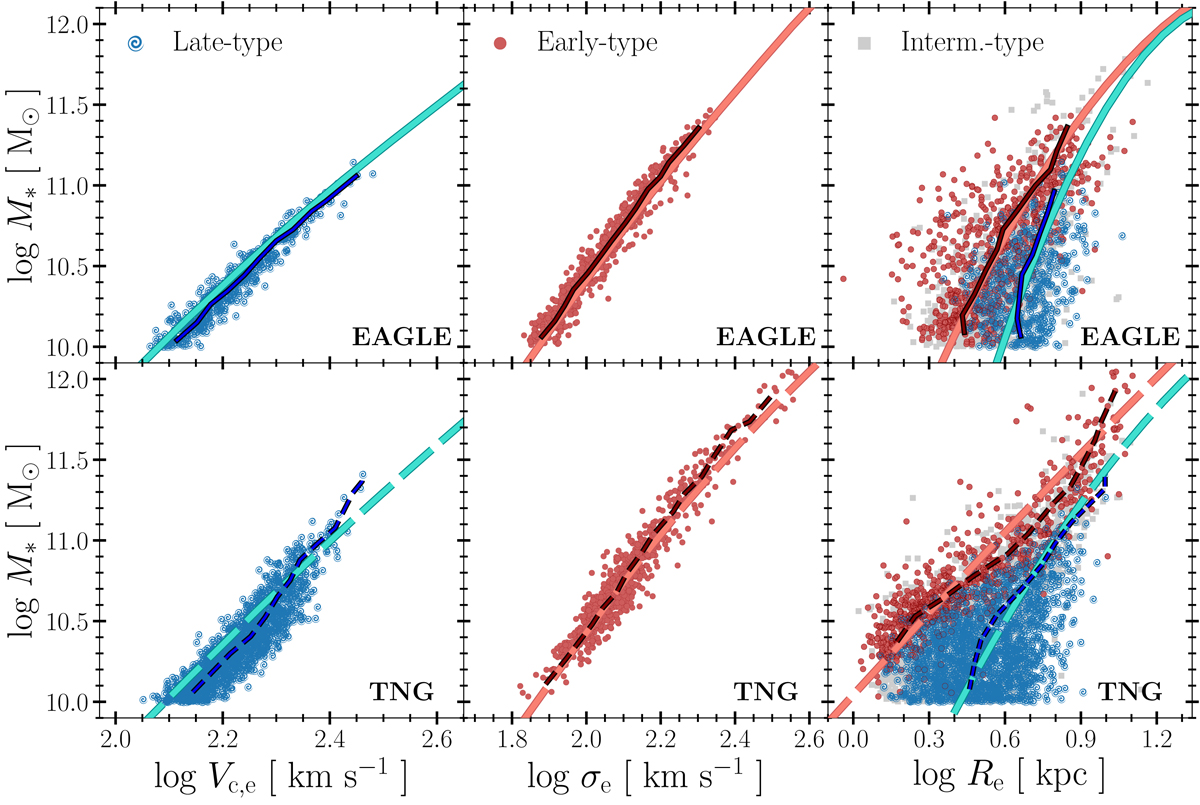
Correlations between the stellar mass, M*, of simulated EAGLE (top row) and TNG (bottom row) galaxies and circular velocities at the stellar half-mass radius, Vc, e, of late-type (S) systems (left column); line-of-sight velocity dispersion, averaged within the stellar effective radius of early-type (E) systems (middle column); and stellar half-mass radius (right column), for all galaxies in the sample. (See Appendix A for details on the morphological classification of simulated galaxies.) In all panels, red circles denote ellipticals, and blue spiral symbols denote spirals. Grey symbols are used to indicate other galaxies of intermediate type. Thick wiggly curves of matching colour indicate the median trends, computed in stellar mass bins. The thick smooth curves are fits used for (or obtained with) the fiducial model described in Sect. 3.3.
Current usage metrics show cumulative count of Article Views (full-text article views including HTML views, PDF and ePub downloads, according to the available data) and Abstracts Views on Vision4Press platform.
Data correspond to usage on the plateform after 2015. The current usage metrics is available 48-96 hours after online publication and is updated daily on week days.
Initial download of the metrics may take a while.