Free Access
Fig. 7
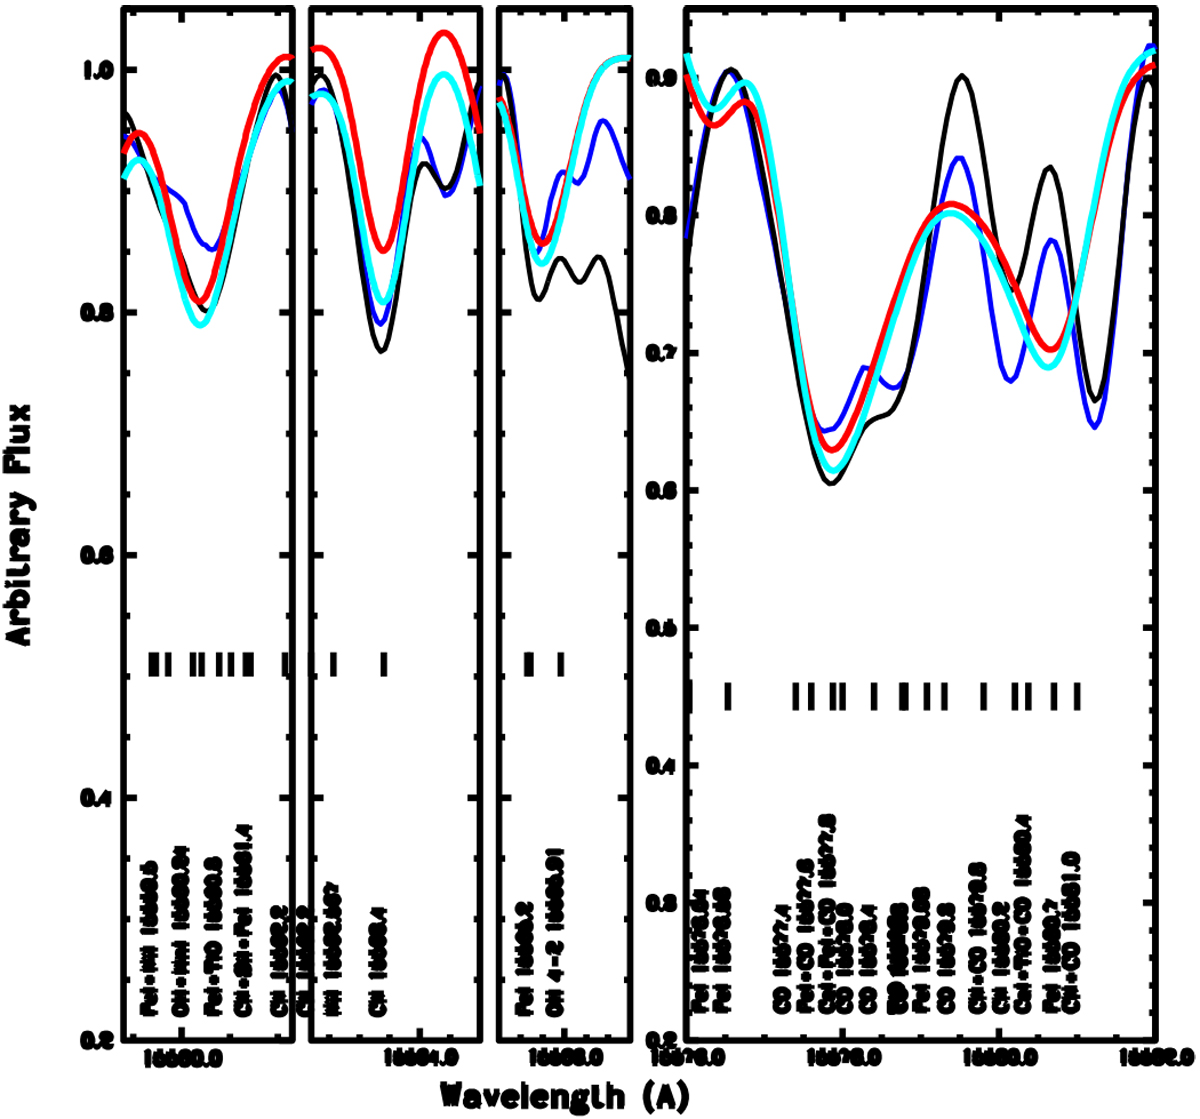
AL 3-6: tentative fit to this low S/N spectrum, showing that it is compatible with a high CNO abundance. Blue and black lines: same observed spectrum normalized in two different ways. Red and cyan lines: synthetic spectra computed with [C/Fe] = 0.7 (red), 0.8 (cyan), [N/Fe] = +1.0, [O/Fe] = +0.8.
Current usage metrics show cumulative count of Article Views (full-text article views including HTML views, PDF and ePub downloads, according to the available data) and Abstracts Views on Vision4Press platform.
Data correspond to usage on the plateform after 2015. The current usage metrics is available 48-96 hours after online publication and is updated daily on week days.
Initial download of the metrics may take a while.