Fig. 5
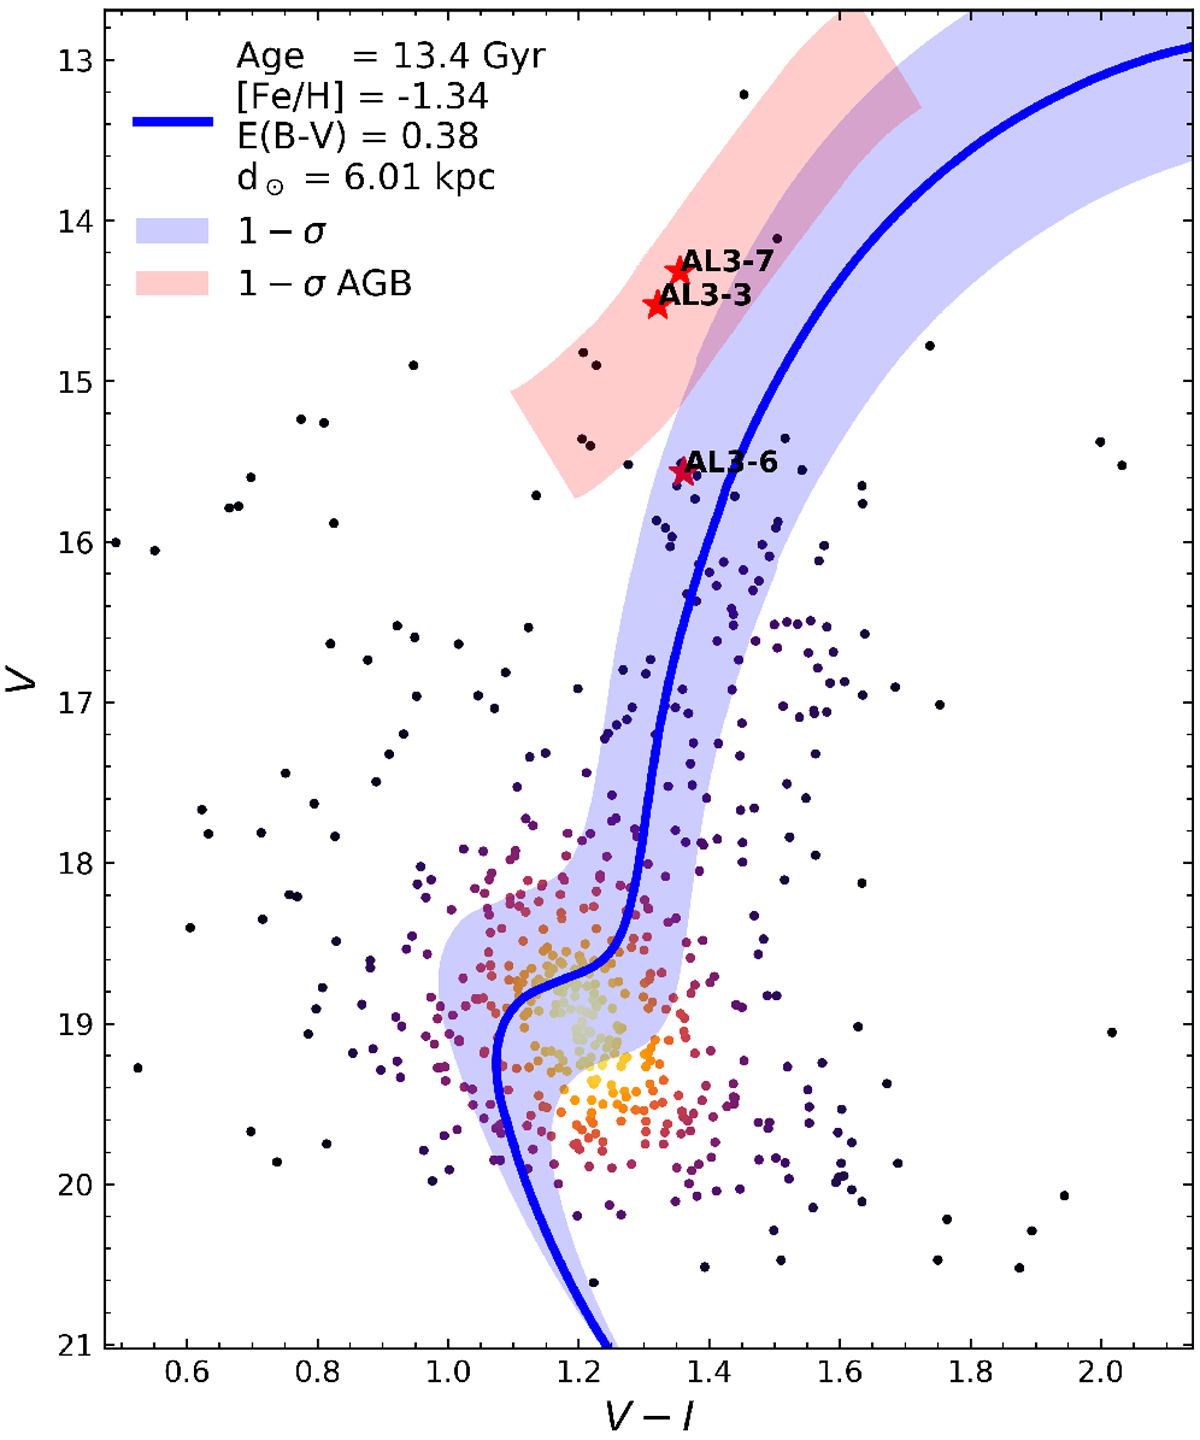
AL 3 V vs. V − I CMD. The black dots are the stars within 120 pixels from the cluster centre (see Ortolani et al. 2006). The red stars are the observed stars of the present work. The solid blue line represents the median solution of the isochrone fitting, while the blue region reveals the solutions within 1 − σ from Dartmouth isochrones, and the rose region corresponds to BaSTI solutions for the AGB.
Current usage metrics show cumulative count of Article Views (full-text article views including HTML views, PDF and ePub downloads, according to the available data) and Abstracts Views on Vision4Press platform.
Data correspond to usage on the plateform after 2015. The current usage metrics is available 48-96 hours after online publication and is updated daily on week days.
Initial download of the metrics may take a while.