Fig. A.1
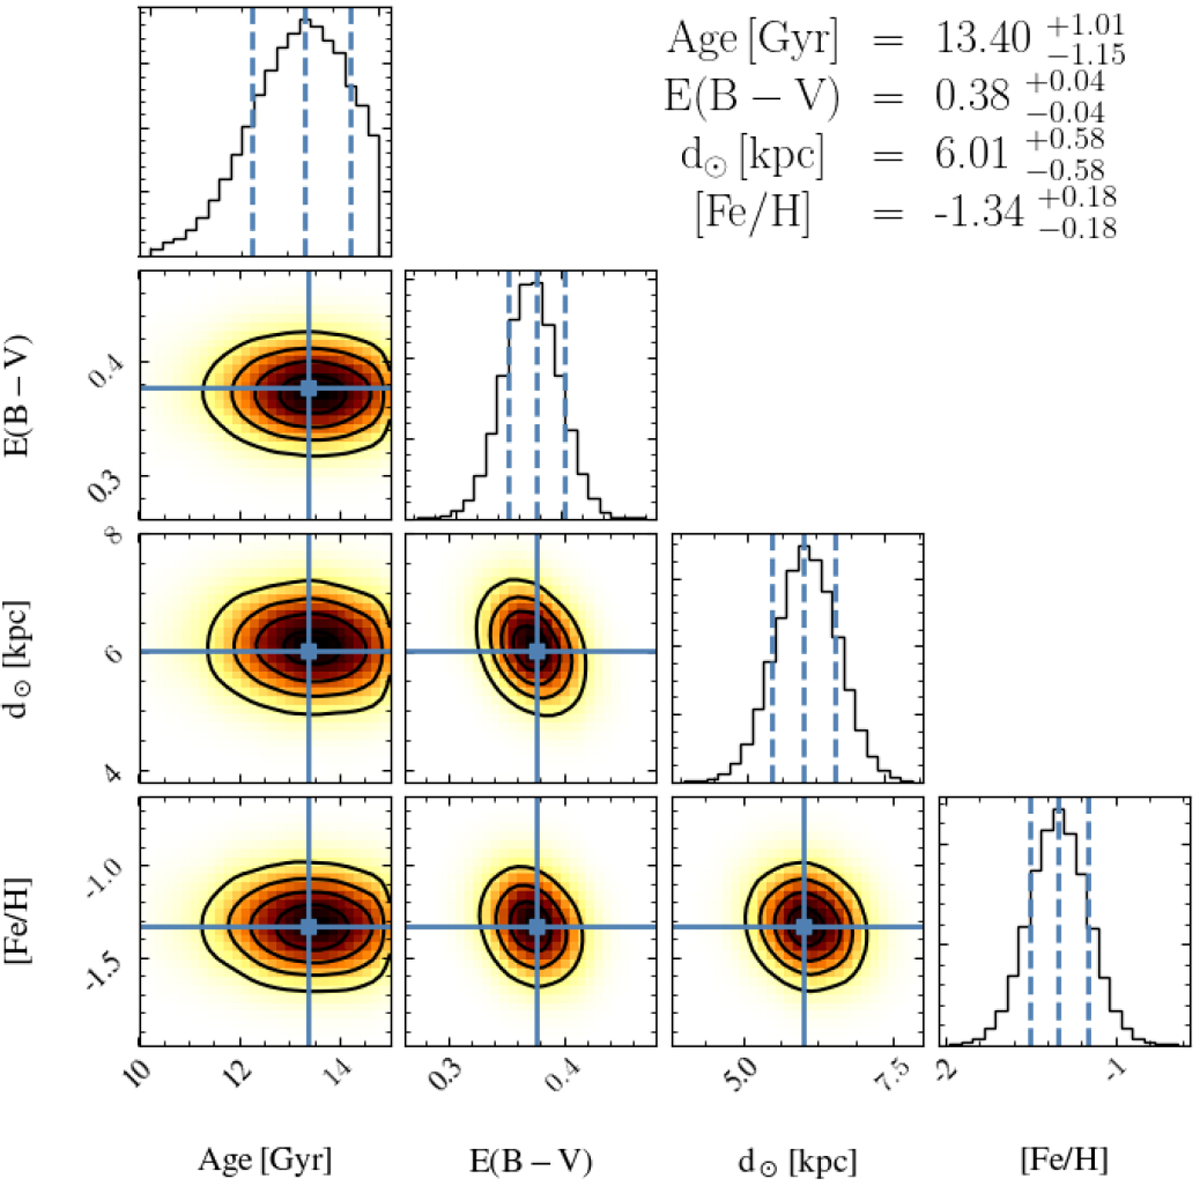
Corner plots representing the 4D parameter space of the Markov chain constructed through the Monte Carlo algorithm for the isochrone fitting. To represent the solutions, we adopt the peak of the distribution as the best value, and the uncertainties are computed using the 16th and 84th percentiles. More details are available in Souza et al. (2020).
Current usage metrics show cumulative count of Article Views (full-text article views including HTML views, PDF and ePub downloads, according to the available data) and Abstracts Views on Vision4Press platform.
Data correspond to usage on the plateform after 2015. The current usage metrics is available 48-96 hours after online publication and is updated daily on week days.
Initial download of the metrics may take a while.