Open Access
Fig. 7
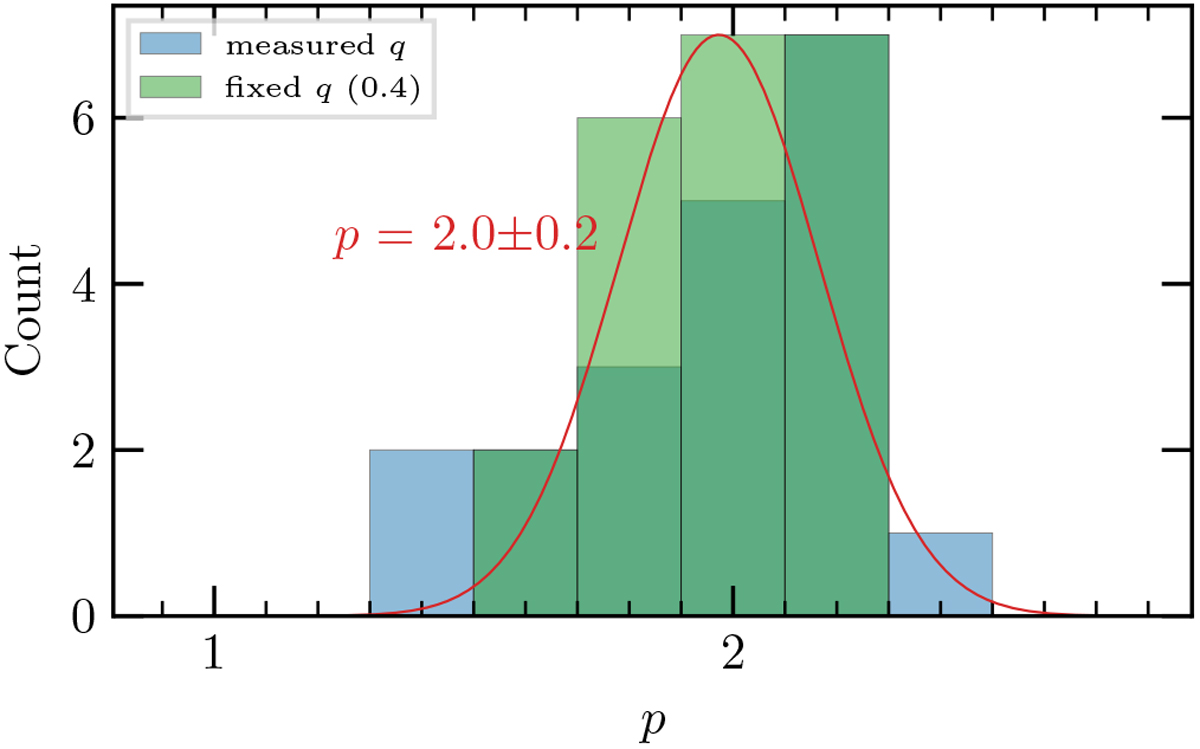
Histogram of the density power-law index p. The density power-law index derived with the measured values of q for each core are shown in blue. In green, the results for p calculated with a fixed temperature index (q = 0.4) for all cores are shown. The red line shows a Gaussian fit to the green histogram.
Current usage metrics show cumulative count of Article Views (full-text article views including HTML views, PDF and ePub downloads, according to the available data) and Abstracts Views on Vision4Press platform.
Data correspond to usage on the plateform after 2015. The current usage metrics is available 48-96 hours after online publication and is updated daily on week days.
Initial download of the metrics may take a while.