Fig. 6
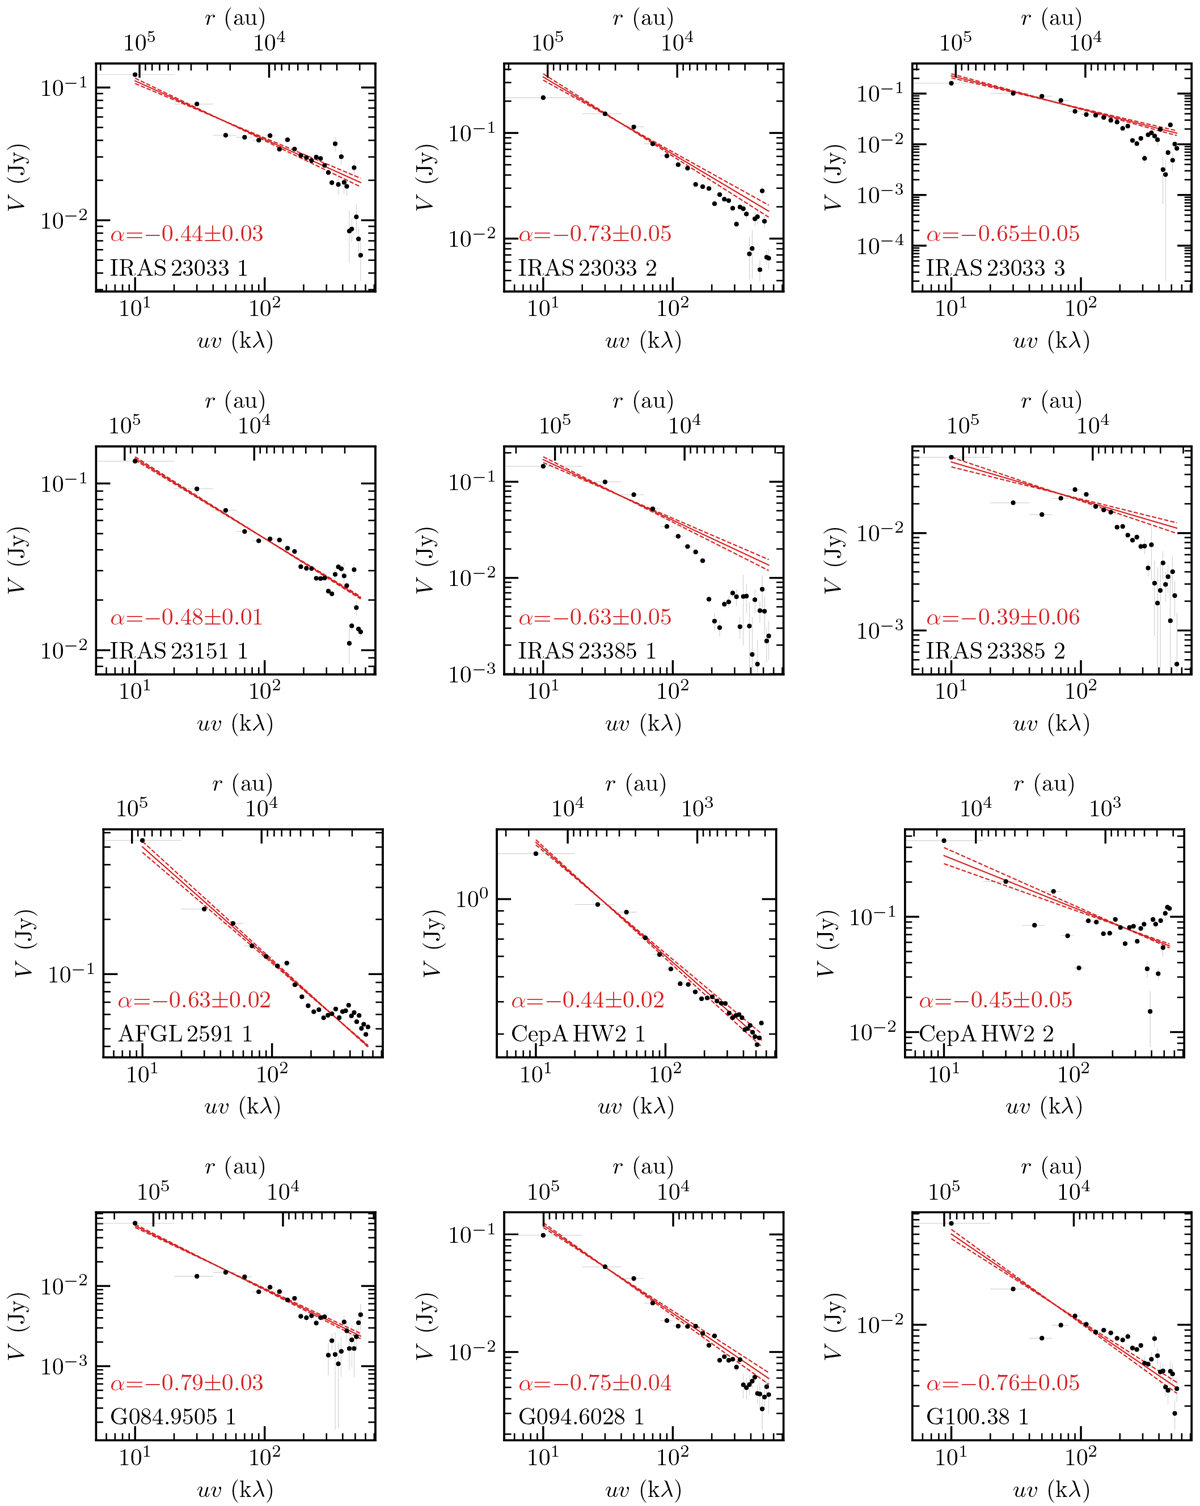
Radial visibility profiles of the 1.37 mm continuum emission of the 22 cores. The black data points show the radial profile of the averaged complex visibilities of the 1.37 mm continuum as a function of uv distance (bottom x-axis) and of the corresponding linear scale (top x-axis). The linear fit and the ±1σ uncertainties are indicated by the solid and dashed red line, respectively.
Current usage metrics show cumulative count of Article Views (full-text article views including HTML views, PDF and ePub downloads, according to the available data) and Abstracts Views on Vision4Press platform.
Data correspond to usage on the plateform after 2015. The current usage metrics is available 48-96 hours after online publication and is updated daily on week days.
Initial download of the metrics may take a while.