Fig. 4
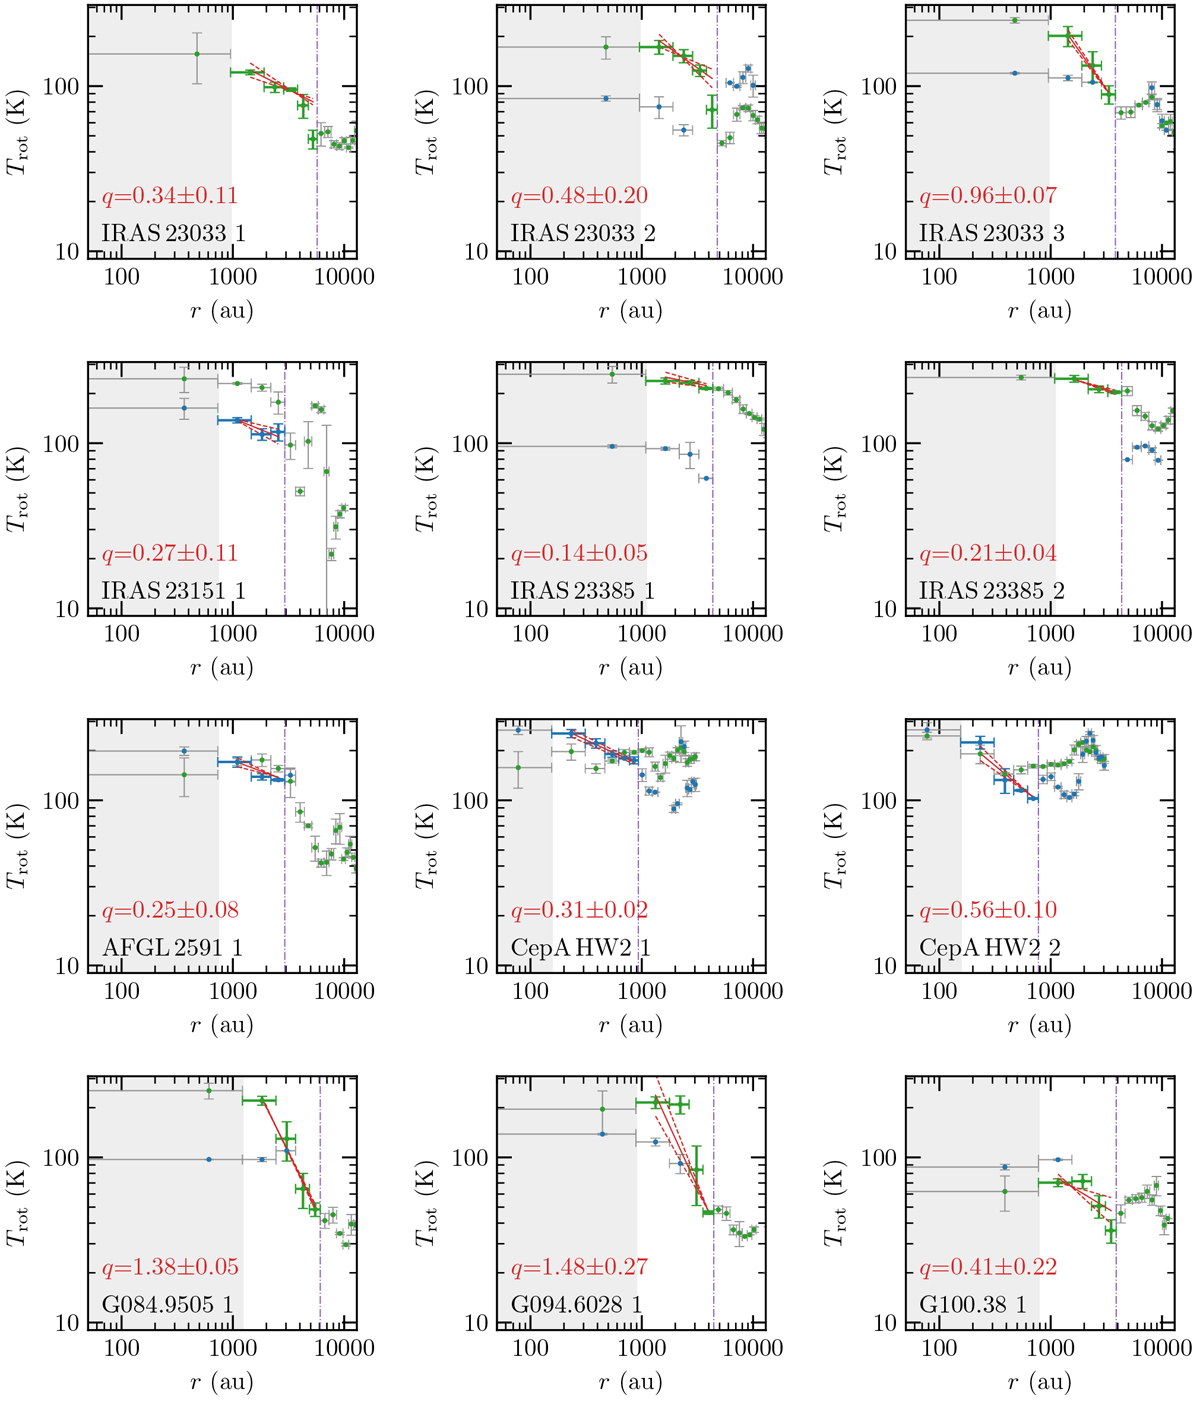
Radial temperature profiles of the 22 cores. Each panel shows the binned radial temperature profile derived from the H2CO (green) and CH3CN (blue) temperature maps shown in Fig. C.1. The data points used for the radial profile fitare shown by corresponding colored errorbars, the data points excluded from the fit are indicated by grey errorbars. The outer radius of the temperature fit is shown by the vertical purple dash-dotted line. The inner unresolved region is shown as a grey-shaded area. The linear fit and the ± 1σ uncertainty are shown by the solid and dashed red lines, respectively.
Current usage metrics show cumulative count of Article Views (full-text article views including HTML views, PDF and ePub downloads, according to the available data) and Abstracts Views on Vision4Press platform.
Data correspond to usage on the plateform after 2015. The current usage metrics is available 48-96 hours after online publication and is updated daily on week days.
Initial download of the metrics may take a while.