Fig. 2
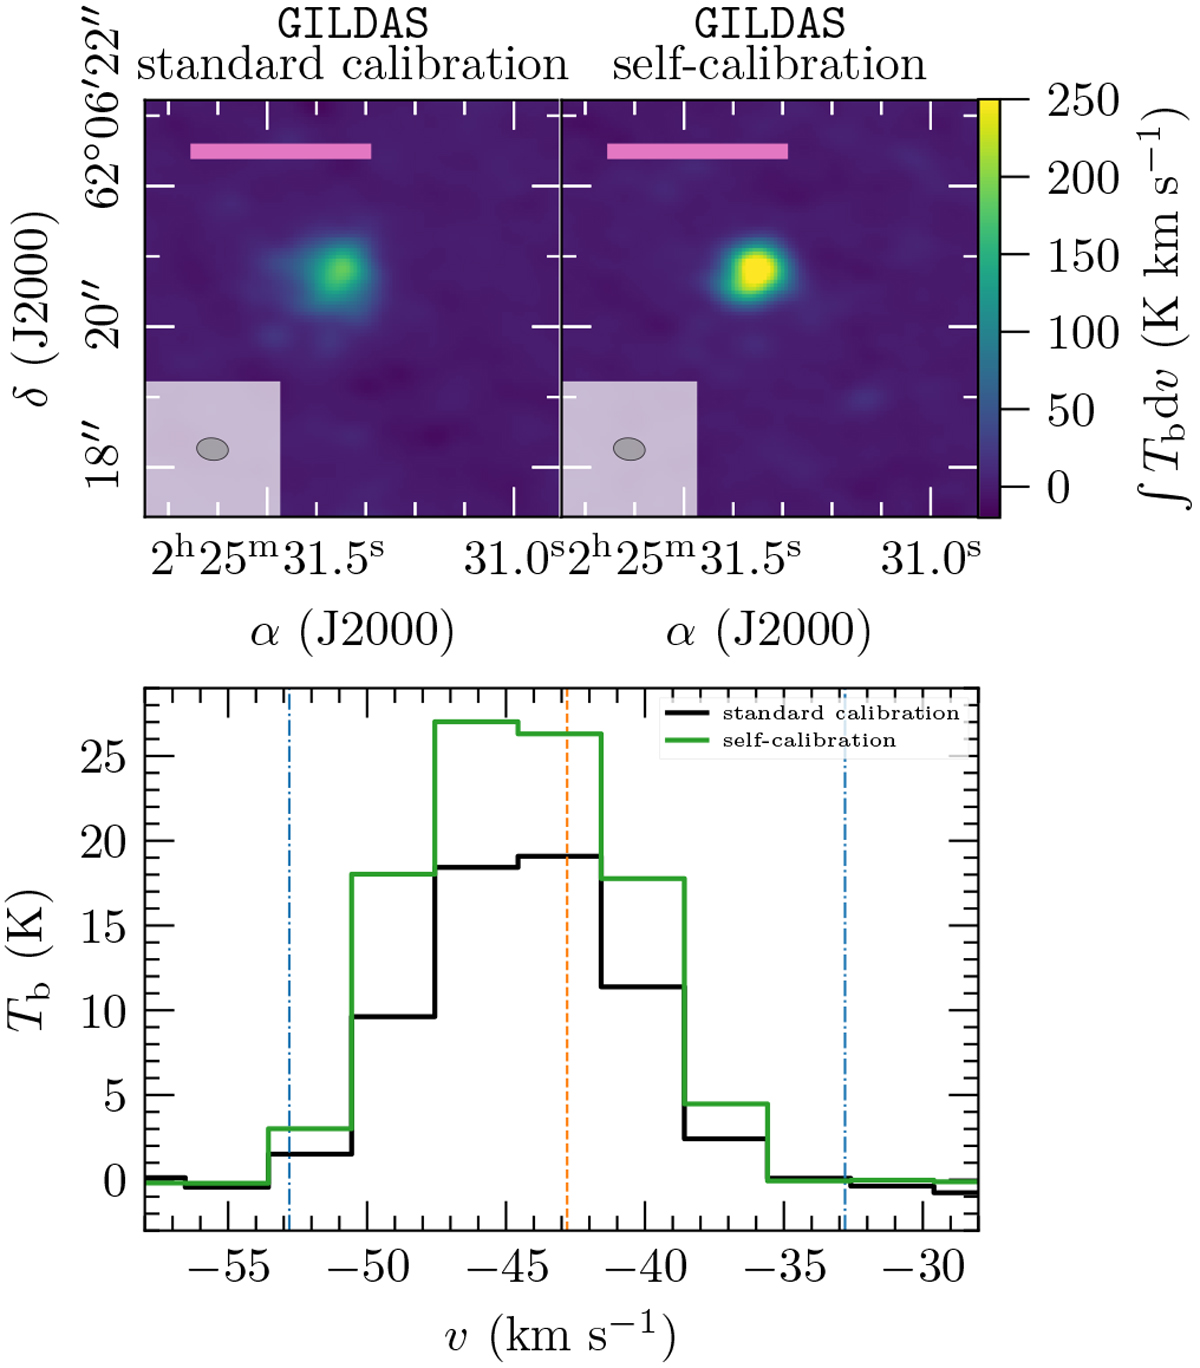
Comparison of the GILDAS standard calibration (left) and GILDAS self-calibration (right) of the W3 IRS4 broadband spectral line data zoomed in toward the position of the continuum peak, shown in the top panels. The integrated intensity of the CH3CN 123 − 113 transition is shown in color. In each panel, the beam size is shown in the bottom left corner and pink bar in the top left corner indicates a linear spatial scale of 5000 au. Bottom panel: CH3CN 123 − 113 spectrum at the position of the W3 IRS4 continuum peak of the GILDAS standard calibrated data (black) and of the GILDAS self-calibrated data (green). The dashed orange line shows the systemic velocity of the region vLSR and the dash-dotted blue lines show the lower and upper velocity limits (vLSR ± 10 km s−1) used for the integrated intensity map shown in the top panel.
Current usage metrics show cumulative count of Article Views (full-text article views including HTML views, PDF and ePub downloads, according to the available data) and Abstracts Views on Vision4Press platform.
Data correspond to usage on the plateform after 2015. The current usage metrics is available 48-96 hours after online publication and is updated daily on week days.
Initial download of the metrics may take a while.