Fig. C.1
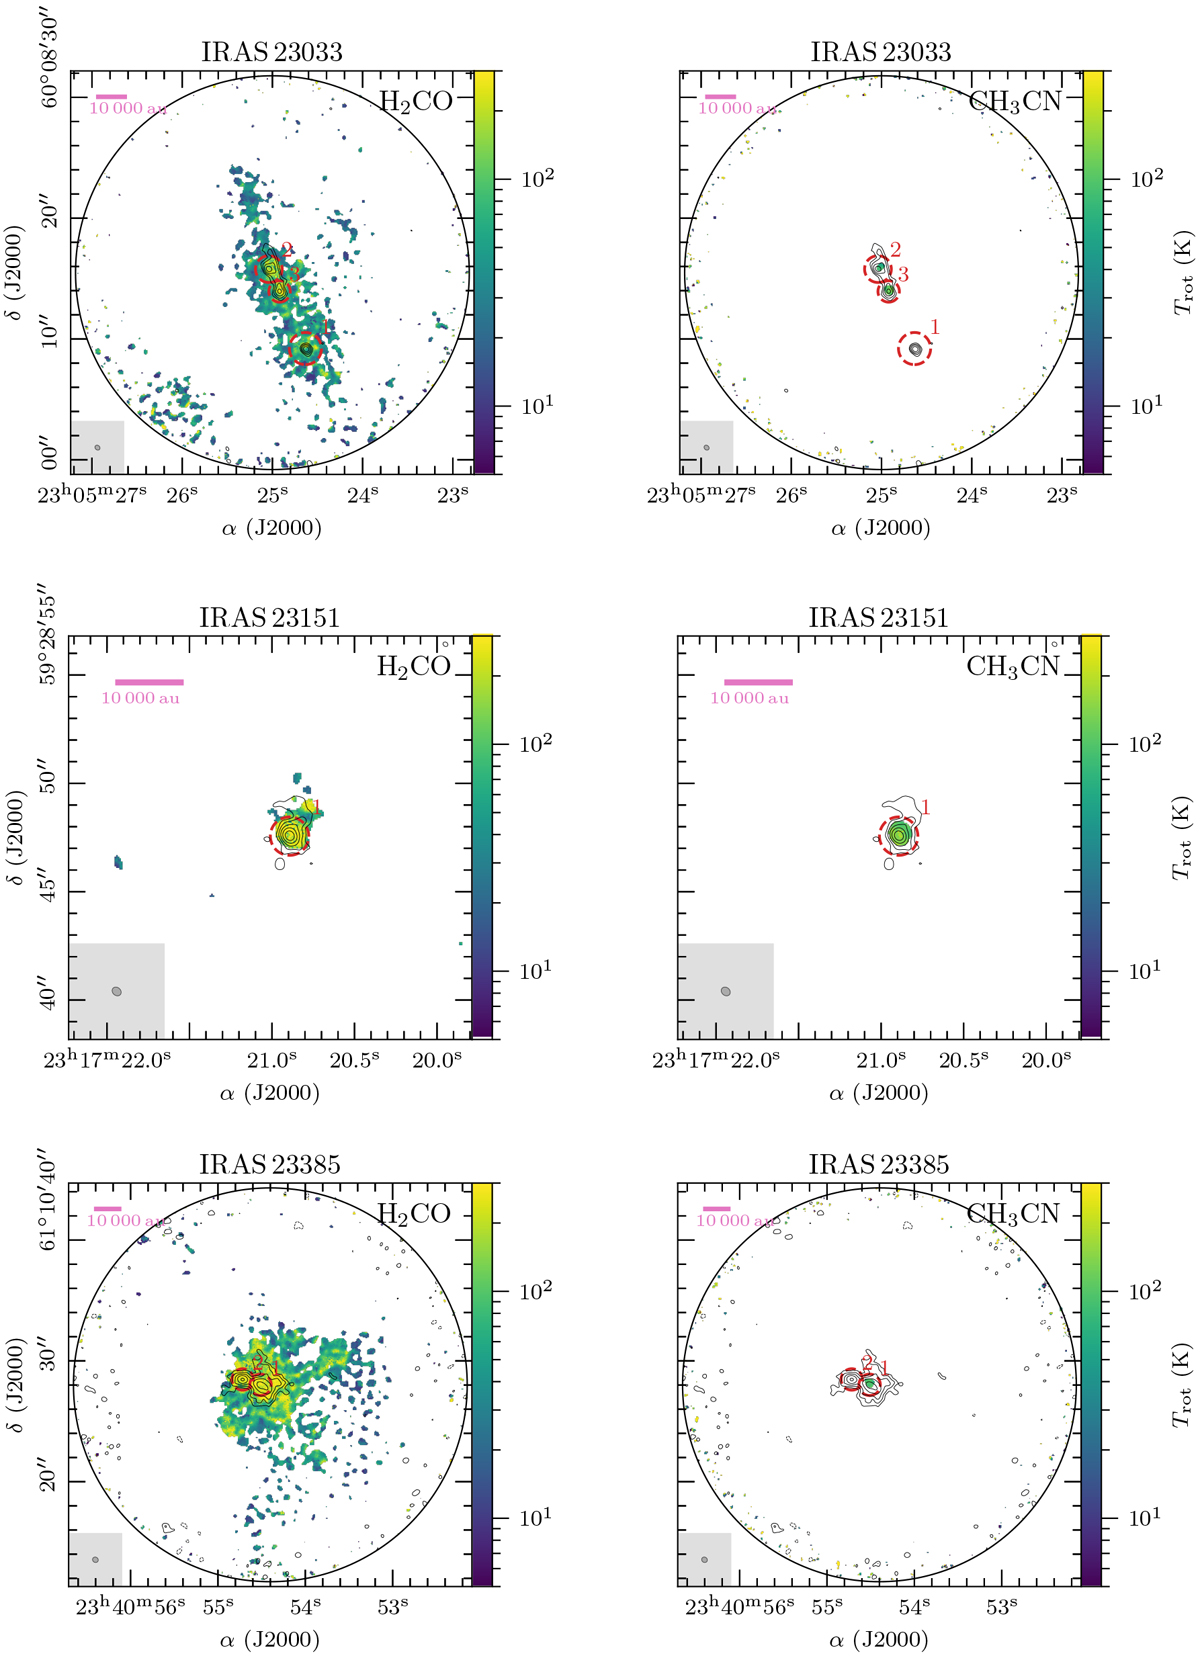
Temperature maps derived with XCLASS. Each panel shows in color the temperature map (left: H2CO, right: CH3CN) and in black contours the 1.37 mm continuum emission. The dashed black contours show the − 5σcont emission andthe solid black contours start at 5σcont with steps increasing by a factor of two (see Table 2 for values of σcont for each region). Each core is marked in red and the dashed red circle indicates the outer radius of the radial temperature fit (Sect. 3.2). The beam size is shown in the bottom left corner in each panel. The pink bar in the top left corner indicates a linear spatial scale of 10 000 au. The primary beam size is indicated by a black circle and for regions with no extended H2CO temperaturemap a smaller field of view is shown.
Current usage metrics show cumulative count of Article Views (full-text article views including HTML views, PDF and ePub downloads, according to the available data) and Abstracts Views on Vision4Press platform.
Data correspond to usage on the plateform after 2015. The current usage metrics is available 48-96 hours after online publication and is updated daily on week days.
Initial download of the metrics may take a while.