Open Access
Fig. 12
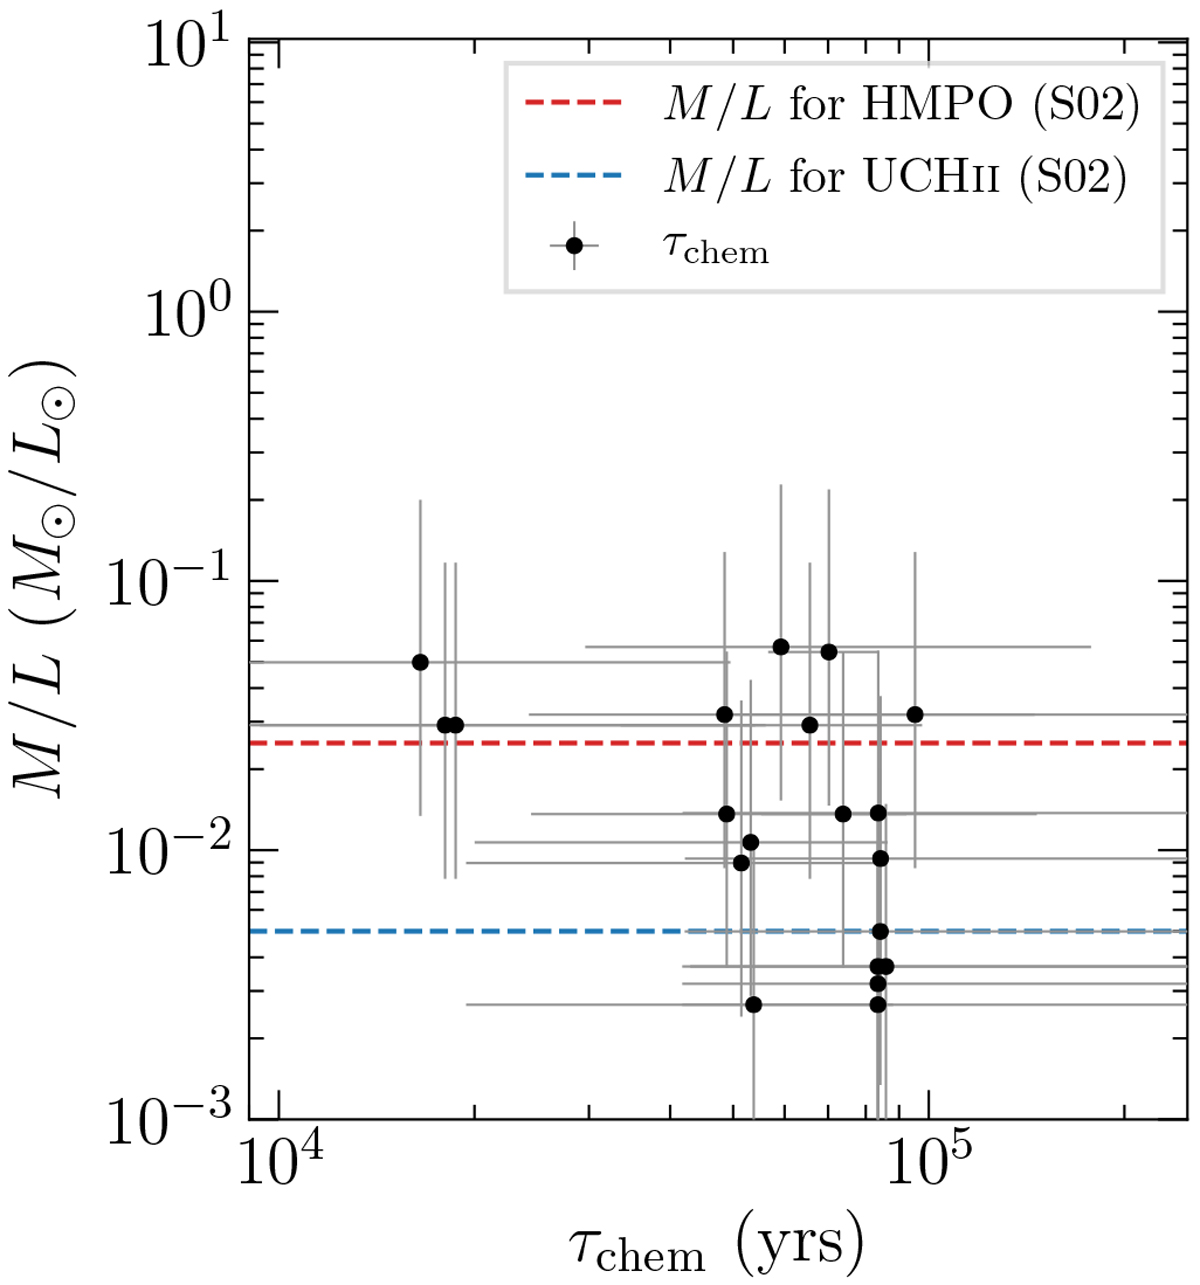
M/L ratio and chemical ages τchem. The mass M and luminosity L for each region are taken from Beuther et al. (2018). The horizontal dashed lines correspond to average M/L ratios for HMPOs (red) and UCHII regions (blue) taken from Sridharan et al. (2002).
Current usage metrics show cumulative count of Article Views (full-text article views including HTML views, PDF and ePub downloads, according to the available data) and Abstracts Views on Vision4Press platform.
Data correspond to usage on the plateform after 2015. The current usage metrics is available 48-96 hours after online publication and is updated daily on week days.
Initial download of the metrics may take a while.