Fig. 10
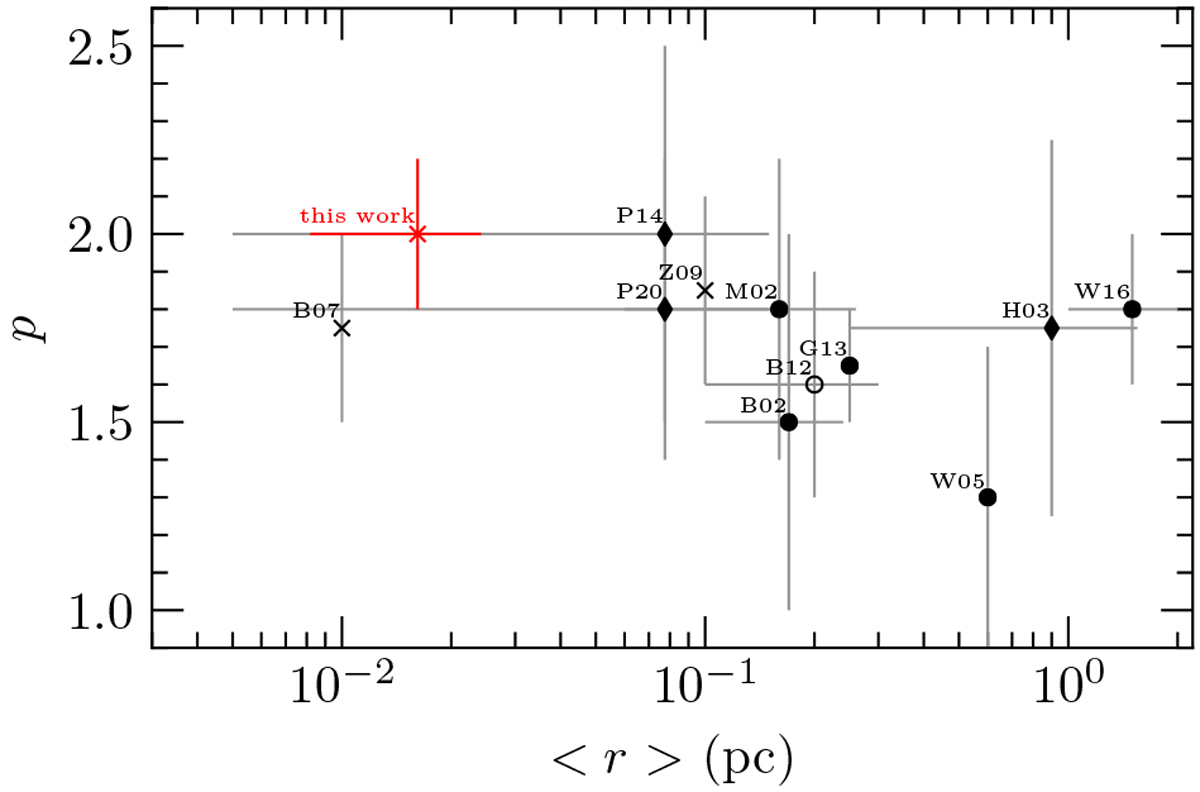
Literature comparison of the density index p at different core or clump sizes, ⟨r⟩. Studies based on interferometric observations are marked by a “ × ”, (sub)mm single-dish observations by a “•”, multi-wavelength observations by a “♦”, and mid-infrared observations by a “○”. References. M02: Mueller et al. (2002); B02: Beuther et al. (2002); H03: Hatchell & van der Tak (2003); W05: Williams et al. (2005); B07: Beuther et al. (2007b); Z09: Zhang et al. (2009); B12: Butler & Tan (2012); G13: Giannetti et al. (2013); P14: Palau et al. (2014); W16: Wyrowski et al. (2016); P20: Palau et al. (2020).
Current usage metrics show cumulative count of Article Views (full-text article views including HTML views, PDF and ePub downloads, according to the available data) and Abstracts Views on Vision4Press platform.
Data correspond to usage on the plateform after 2015. The current usage metrics is available 48-96 hours after online publication and is updated daily on week days.
Initial download of the metrics may take a while.