| Issue |
A&A
Volume 648, April 2021
|
|
|---|---|---|
| Article Number | A34 | |
| Number of page(s) | 17 | |
| Section | Galactic structure, stellar clusters and populations | |
| DOI | https://doi.org/10.1051/0004-6361/202039620 | |
| Published online | 07 April 2021 | |
Detection of new O-type stars in the obscured stellar cluster Tr 16-SE in the Carina Nebula with KMOS⋆,⋆⋆
1
Universitäts-Sternwarte München, Ludwig-Maximilians-Universität, Scheinerstr. 1, 81679 München, Germany
e-mail: This email address is being protected from spambots. You need JavaScript enabled to view it.
2
Dipartimento di Fisica “E. Fermi”, Universita di Pisa Largo Bruno Pontecorvo 3, 56127 Pisa, Italy
3
INAF-Osservatorio Astrofisico di Arcetri, Largo E. Fermi 5, 50125 Firenze, Italy
4
INFN, Sezione di Pisa, Largo Bruno Pontecorvo 3, 56127 Pisa, Italy
Received:
8
October
2020
Accepted:
11
February
2021
Abstract
Context. The Carina Nebula harbors a large population of high-mass stars, including at least 75 O-type and Wolf-Rayet (WR) stars, but the current census is not complete since further high-mass stars may be hidden in or behind the dense dark clouds that pervade the association.
Aims. With the aim of identifying optically obscured O- and early B-type stars in the Carina Nebula, we performed the first infrared spectroscopic study of stars in the optically obscured stellar cluster Tr 16-SE, located behind a dark dust lane south of η Car.
Methods. We used the integral-field spectrograph KMOS at the ESO VLT to obtain H- and K-band spectra with a resolution of R ≈ 4000 (Δλ ≈ 5 Å) for 45 out of the 47 possible OB candidate stars in Tr 16-SE, and we derived spectral types for these stars.
Results. We find 15 stars in Tr 16-SE with spectral types between O5 and B2 (i.e., high-mass stars with M ≥ 8 M⊙), only two of which were known before. An additional nine stars are classified as (Ae)Be stars (i.e., intermediate-mass pre-main-sequence stars), and most of the remaining targets show clear signatures of being late-type stars and are thus most likely foreground stars or background giants unrelated to the Carina Nebula. Our estimates of the stellar luminosities suggest that nine of the 15 O- and early B-type stars are members of Tr 16-SE, whereas the other six seem to be background objects.
Conclusions. Our study increases the number of spectroscopically identified high-mass stars (M ≥ 8 M⊙) in Tr 16-SE from two to nine and shows that Tr 16-SE is one of the larger clusters in the Carina Nebula. Our identification of three new stars with spectral types between O5 and O7 and four new stars with spectral types O9 to B1 significantly increases the number of spectroscopically identified O-type stars in the Carina Nebula.
Key words: open clusters and associations: individual: TR 16-SE / stars: formation / stars: early-type
Reduced spectra are only available at the CDS via anonymous ftp to cdsarc.u-strasbg.fr (130.79.128.5) or via http://cdsarc.u-strasbg.fr/viz-bin/cat/J/A+A/648/A34
Based on observations collected at the European Southern Observatory under ESO program 097.C-0102.
© ESO 2021
1. Introduction
The Carina Nebula, at a distance of ≈2.3 kpc (see Smith & Brooks 2008, for a review), is one of the most massive and active star forming regions in our Galaxy and harbors a large population of high-mass stars (M ≥ 8 M⊙). With 70 optically identified O-type stars, three known Wolf-Rayet (WR) stars, and η Car with its companion (see Smith 2006; Alexander et al. 2016; Hanes et al. 2018), the currently known population comprises 75 stars with masses above 18 M⊙. These massive stars constitute a large OB association, in which Tr 14, 15, and 16 are the most prominent open clusters in optical images.
The Carina Nebula still contains a very large mass (∼106 M⊙; Preibisch et al. 2012) of dusty gas clouds. Maps of the cloud column density derived from far-infrared (Preibisch et al. 2012), submillimeter (Preibisch et al. 2011c), and CO observations (Rebolledo et al. 2016) show that the structure of these clouds is very inhomogeneous and that the visual cloud extinction reaches values of AV ∼ 10 mag or more at several locations in the nebula. Given the considerable obscuration effect of these dark clouds, only deep infrared observations can reveal the full stellar population. Deep near-infrared (NIR) surveys of the Carina Nebula have been obtained with HAWK-I on the Very Large Telescope (VLT) at the European Southern Observatory (ESO; Preibisch et al. 2011b) as well as with the VISTA telescope (Preibisch et al. 2014). The Carina Nebula was also mapped at mid-infrared wavelengths with the Spitzer Space Observatory (Smith et al. 2010). In combination with the comprehensive X-ray observations obtained in the Chandra Carina Complex Project (CCCP; see Townsley et al. 2011), these infrared data yielded comprehensive information about the stellar populations (e.g., Feigelson et al. 2011; Preibisch et al. 2011a; Povich et al. 2011).
However, the current census of high-mass stars in the Carina Nebula is probably still substantially incomplete. For example, Roccatagliata et al. (2013) found that the total far-infrared luminosity of the cloud complex is ≈70% larger than expected from the total stellar far-ultraviolet luminosity of the currently known OB stars. The analysis of bright Spitzer infrared sources by Povich et al. (2011) led to the identification of 94 new candidate OB stars in the Carina Nebula with extinction values up to AV ≈ 35 mag.
Due to the location of the Carina Nebula very close to the galactic plane, the vast majority of all detected infrared sources are distant field stars in the galactic background. The only way to reliably identify obscured OB stars among the many background contaminators is thus by spectroscopy. Spectroscopic surveys (see the summary in Smith 2006, for earlier observations) have, however, so far only been performed for the unobscured population of optically bright stars (Alexander et al. 2016; Damiani et al. 2017; Mohr-Smith et al. 2017; Kiminki & Smith 2018). This lack of spectroscopic information for the obscured, optically faint high-mass star candidates is a serious gap in our knowledge of the stellar population in the Carina Nebula and limits our understanding of the global energetics and feedback processes in this important star forming region.
The V-shaped dark cloud structure that intersects the central parts of the Carina Nebula contains a clustering of infrared and X-ray sources, denoted as Tr 16-SE (Sanchawala et al. 2007; Smith et al. 2010; Feigelson et al. 2011), about 9 arcminutes southeast of η Car and the optically prominent stellar cluster Tr 16 (see Fig. 1). Most stars in Tr 16-SE are invisible or very faint in optical images, and until recently the only star with a known optical spectral type was the double-lined O5.5V+O9.5V spectroscopic binary MJ 596 (Niemela et al. 2006), also known as V662 Car. The study of the bright Spitzer point sources by Povich et al. (2011) found six candidate OB stars in Tr 16-SE, but none of these have been confirmed with spectroscopy to date. This makes Tr 16-SE a very interesting target for the search for still unidentified high-mass stars in the Carina Nebula.
 |
Fig. 1. Optical and infrared images of the central part of the Carina Nebula. Left: optical image reproduced from the ESO Photo Release eso1250 (image credit: VPHAS+ Consortium/Cambridge Astronomical Survey Unit). It is composed of a B-band image in the blue color channel, a g-band image in the green color channel, and r-band and Hα-band images in the red color channel. The white box marks the region around the pillar G 287.75−0.66 (which is not visible in this optical image). The dashed yellow circle marks the region of the obscured cluster Tr 16-SE and the dashed blue ellipse the cluster Tr 16. The positions of the stars MJ 596, MJ 633, and η Car are marked. North is up, and east is to the left. Right: color composite image of the region around the pillar, composed from our VISTA Ks-band image in blue, the Spitzer 5.8 μm image in green (where the area around η Car [near the upper right corner] is affected by saturation), and our LABOCA 870 μm map in red. The white 4′ × 4′ square marks the region of the pillar G 287.75−0.66, and the circles show the KMOS patrol fields for the B (blue), F (orange), and C (white) observations. North is up, and east is to the left. |
The very high levels of ionizing radiation and stellar wind power from the numerous massive stars in the Carina Nebula profoundly influence the surrounding clouds, making it a textbook example for studies of stellar feedback and the resulting processes of cloud disruption and triggered star formation. The infrared to submillimeter images (see Smith et al. 2010; Preibisch et al. 2012, 2011c) revealed numerous pillar-like cloud structures in the southern parts of the Carina Nebula. Such pillars are thought to be a natural outcome of the feedback from strong ionizing radiation fields on clouds (see, e.g., Gritschneder et al. 2010; Dale et al. 2013; McLeod et al. 2016; Klaassen et al. 2020). While almost all pillars in the Carina Nebula point toward the massive stars around η Car in Tr 16, the Spitzer image (see Fig. 1) reveals one prominent exception approximately 9′ southeast of η Car, where one bright and well-structured pillar does not point toward η Car (which would be north) but instead points in a southwestern direction toward a region where no particularly bright stars are seen in optical images. This pillar was denoted as G 287.75−0.66 by Smith et al. (2010) and is part of the cloud structure that creates the remarkable V-shaped dark lane in the central part of the Carina Nebula in optical images (see Fig. 1). Interestingly, this pillar only points in the direction of the obscured cluster Tr 16-SE.
Our aims are thus to perform the first systematic spectroscopic study of the stellar population in Tr 16-SE and thus improve the census of massive stars (M ≥ 8 M⊙) in the Carina Nebula; we are therefore interested in identifying stars with spectral types from O to B2, which we call “OB2 stars” in the following. Due to the high level of obscuration, most stars in Tr 16-SE are too faint for optical spectroscopy; we therefore obtained NIR spectra for a magnitude-limited sample of 50 stars in the cluster.
2. K-band Multi-Object Spectrograph observations
2.1. Target sample and observing strategy
Our goal was to obtain H- and K-band infrared spectra of all potential high-mass stars in Tr 16-SE (M ≳ 8 M⊙, corresponding to spectral types from O to B2) in the Carina Nebula. The target stars were selected from our VISTA photometry catalog of the Carina Nebula (see Preibisch et al. 2014). A brightness limit of Ks ≤ 12 mag was chosen because any star at the distance of the Carina Nebula with a mass of M ≥ 8 M⊙ [M ≥ 18 M⊙] will be brighter than this limit for extinctions of up to AV ≈ 11 mag [AV ≈ 28 mag]. We can thus be confident that such a magnitude-limited sample will contain all the O-type stars (M ≥ 18 M⊙) and most of the early B-type stars (8 M⊙ ≤ M ≤ 18 M⊙) in Tr 16-SE. We did not use any further conditions (e.g., luminosity estimates from spectral energy distribution analysis or X-ray detection) in the construction of our sample in order to keep it as unbiased as possible.
As the spatial selection region for our Tr 16-SE sample, we used a 5.7′ × 5′ box centered at the J2000 coordinates RA = 10h45m31.7s and Dec = −59° 48′48″. This area contains 47 stars1 with Ks ≤ 12. We were able to obtain spectra of 45 of these 47 stars (i.e., we have an observational completeness of 95.74%); the only two stars in our selection region that could not be observed are VCNS J104554.89-594818.8 (Ks = 7.84) and VCNS J104554.36-595006.6 (Ks = 11.75).
Due to the number of our targets and the wide range of magnitudes of the individual target stars, the observational sequence was split into three individual observations, denoted as the B (bright star), F (faint star), and C (calibrator star) observations in the following. The B observation contained the stars in Tr 16-SE with Ks ≈ [7.0−10.6] mag and H ≈ [7.5−11.7] mag. The F observation contained the stars in Tr 16-SE with Ks ≈ [10.6−12.0] mag and H ≈ [10.8−13.2] mag.
The C observation targeted 14 known high-mass stars in the cluster Tr 16, for which spectral types between O5 and B2 had been previously determined from optical spectroscopy; Table 1 lists the positions, names, and spectral types of these stars. They were observed and analyzed in the same way as our target stars in Tr 16-SE and then used as spectral standards for the classification of the target stars in Tr 16-SE. Figure 1 shows the positions of the three observations.
Calibrator star sample.
Parameters of the KMOS observations.
2.2. KMOS configuration
The K-band Multi-Object Spectrograph (KMOS) at the ESO VLT allows the simultaneous observation of up to 24 target stars within a circular 7.2′ diameter patrol field. As described in more detail in Sharples et al. (2013) and on the ESO instrument web page2, KMOS employs 24 configurable arms that position pickoff mirrors at user-specified locations in the focal plane. Each subfield is fed to an image slicer integral-field unit (IFU) with a square field of view of 2.8″ × 2.8″ that provides a uniform spatial sampling of 0.2″ × 0.2″. The light from each IFU is then dispersed by grating spectrometers that generate 14 × 14 spectra with ∼1000 Nyquist-sampled spectral resolution elements.
While KMOS allows a rather flexible spatial placement of the 24 individual pickoff mirrors, there are some restrictions on the configuration, for example, a minimum distance of at least 6″ between two neighboring pickoff mirrors. It is thus not always possible to observe all desired target stars in one field. After performing detailed experiments, we were finally able to establish configurations for the three observations that allowed us to obtain spectra of 45 out of the 47 OB candidate stars in Tr 16-SE and all 14 calibrator stars.
The resulting spectra are denoted by the corresponding B, F, or C prefixes and a running number corresponding to the IFU (e.g., B1). While the target stars were generally centered on the IFU, our target star, J104530.29–594824.5, has a close companion (J104530.42–594825.4, angular separation 1.3″), and as such both stars could be observed in one IFU (F12); their spectra are denoted as F12-1 and F12-2. In order to employ all available KMOS arms in the F observation, we also observed one star (F21) with Ks = 12.24, which is slightly fainter than our magnitude limit.
Since the C observation partly overlapped with the Tr 16-SE target field (see Fig. 1), six of the KMOS arms not needed for the calibrator stars were used for additional, redundant observations of target stars in Tr 16-SE; the two spectra of these double observations were reduced and analyzed independently, and they served as a consistency check for our analysis. Furthermore, three KMOS arms (C16, C17, and C18) were put on stars in or near the cluster Tr 16.
In each observation, one KMOS arm was used for a simultaneous sky observation. The coordinates of the stars in our three different observations (B, F, and C) are listed in Table B.1.
2.3. Spectroscopic observations
We obtained KMOS spectra in the H and the K spectral bands, which provide a wavelength coverage of [1.456−1.846] μm and [1.934−2.460] μm, respectively, and a spectral resolving power of R(H) ≃ 4040 and R(K) ≃ 4230. The observations were carried out on 21 February 2016 (PI: Preibisch, 097.C-0102(A)) between 02:37:34 UT and 04:58:25 UT under photometric sky conditions. The median Differential Image Motion Monitor (DIMM) seeing at 500 nm was ≈1.4″; the corresponding full width at half maximum (FWHM) of the point spread function (PSF) in the NIR is ≈1.0″. For each observation, target and sky-offset exposures were alternated in a target-sky-target sequence. The sky regions were observed by rotating and shifting the arms without altering the configuration. Each science observation was performed with three dither positions and a dither size of 0.2″.
For the B and C observations, the individual integration time was 3 seconds and the number of integrations was 14 (13) for the H-band (K-band), resulting in a total exposure time of 42 s (39 s). Furthermore, an additional long exposure on sky of 42 (39) seconds for the H-band (K-band) was executed at the end of each science observation. For the F observation, the individual integration time was 20 seconds; the number of integrations was eight (six) for the H-band (K-band), leading to a total exposure time of 160 s (120 s).
2.4. Data reduction
The data were reduced using the ESO Recipe Flexible Execution Workbench (Reflex) and the ESO Recipe Execution Tool (esorex), as described by (Freudling et al. 2013), using the standard KMOS/esorex routines. Sky subtraction and telluric correction were performed with the sky tweaking method described by Davies et al. (2013b); a comprehensive description of the method can be found in Coccato et al. (2019). The standard star used for the telluric correction (and later also for flux calibration) was the B3V star HD 93695.
From the final data cubes, spectra were extracted using the “optimal extraction method” provided by the pipeline. For the two cases where more than one source was present per IFU (targets F12-1 & F12-2 and targets B24 & F24), the extraction was performed manually with QFitsViewer, employing circular apertures with radii of 2 pixels and 3 pixels.
2.5. Resulting spectra
The resulting spectra were flux-calibrated using the B3V standard star and stored in units of erg s−1 cm−2 Å−1. They have a spectral dispersion of 2.16 Å per pixel in the H-band and 2.81 Å per pixel in the K-band. For the analysis of the line strengths, we performed a continuum normalization of all spectra with cubic spline interpolation using ten to 30 points in the continuum. The normalized spectra are displayed in Figs. A.1–A.6.
In order to characterize the quality of our spectra, we determined the signal-to-noise ratio (S/N) with the DER_SNR algorithm described in Stoehr et al. (2008). In order to avoid spectral regions with strong features, we used the wavelength intervals [1.62−1.63]+[1.65−1.67] μm for the H-band and [2.12−2.15]+[2.22−2.25] μm for the K-band. The S/N of the target spectra ranges from values of 14 to 545 with a mean (median) value of 132 (81) for the H-band, and from values of 26 to 348 with a mean (median) value of 115 (95) for the K-band.
3. Spectral classification
3.1. Classification strategy
Since the aim of our study was to identify high-mass stars (M ≥ 8 M⊙) in the Carina Nebula, we focused our efforts on those targets that show evidence of being of O- or early B-type stars (not later than B2), which we denote as OB2 stars. The primary spectral indicators for these hot stars are the helium lines. It is well established (see, e.g., Gray & Corbally 2009; Hanson et al. 2005) that stars with spectral types earlier than B3 generally show He I lines and that stars with spectral types O8 or earlier also show He II lines. These expectations are very well confirmed in the spectra of our calibration stars that have optically determined spectral types. We therefore considered all stars that clearly show He lines as OB2 stars and estimated their spectral types as described in Sect. 3.3.
Stars that show no clear He lines must have spectral types later than B2 and thus stellar masses < 8 M⊙. As these stars are not relevant for the aims of our study and because our target sample is clearly incomplete in this mass range, we limited our efforts to characterizing such stars with crude estimates. The Ks ≤ 12 mag limit for our target sample implies the lower limit in stellar mass (or spectral type) that we can expect to find in our sample if the target star is at the distance of the Carina Nebula. According to the CMD 3.3 web interface3 for the PARSEC stellar models (Bressan et al. 2012), this magnitude limit corresponds to a stellar mass of ∼2.5 M⊙ and a late F to early G spectral type for stars at ages between 1 and 3 Myr if there is no extinction. We thus expect that our sample should contain some intermediate-mass young stars, some of which should display the typical spectral signature of Herbig AeBe stars (see Herbig 1994).
These considerations also imply that any cool stars (spectral type later than G) we find in our sample must either be foreground stars or red giants; in both cases, these stars would be unrelated “field stars” (since no red giants are expected to be present in the young stellar population of the Carina Nebula). Therefore, stars with cool spectra are not interesting4 for the purposes of our study.
3.2. Diagnostic lines in the KMOS spectra
For the classification of our target stars we used the following diagnostic lines in the H- and K-bands.
3.2.1. He II lines
Our KMOS spectra contain the He II 7–12 line at 1.6918 μm and the He II 7–10 line at 2.1885 μm, both of which are clear signatures of O-type stars.
In our calibrator sample, the He II 7–12 line is clearly present in all stars down to spectral type O6 but is not seen in later type stars; it shows equivalent widths up to 0.35 Å in the hottest stars. The He II 7–10 line is clearly seen in the hottest stars and down to spectral type O7.5, but not in later type stars; it shows equivalent widths up to 1.0 Å in the hottest stars.
3.2.2. He I lines
For our analysis, we used the He I 1s3p 3P0 → 1s4d 3D triplet at 1.7002 μm, the He I 1s3p 3P0 → 1s4s 3S triplet at 2.1120 μm, and the He I 1s3p 3P0 → 1s4s 1S line and 2.1132 μm, the second and third of which form a blend at ≈2.1126 μm at the resolution of our KMOS spectra. In our calibrator sample, these He I lines are seen in all O-type stars and down to spectral type B2 (the latest spectral type in our calibrator sample). The strength of He I 1.7002 μm increases from 0.5 Å for the O5 stars toward 1.9 Å in the early B-type stars. The He I 2.1126 μm line shows a similar tendency of line strength versus spectral type, but it appears in emission (with equivalent widths up to −3 Å) in the hottest (O5) stars. It is blue-shifted in the stars later than O6. These He I lines are expected to disappear in stars cooler than spectral types B3-4 (see, e.g., Repolust et al. 2005).
3.2.3. H lines
Our spectra contain the Br 7 (2.1655 μm) to Br 15 (1.5701 μm) atomic hydrogen lines. Most of these, in particular the Br 7 (= Brγ) line, are seen in all our calibrator spectra. As expected, their line strength generally decreases with increasing temperature. The equivalent widths of the Brγ line in our calibrator spectra range up to 6.5 Å; the line is seen in emission in one star. In general, strong Brγ lines are also seen in substantially cooler (late B, A, and F) stars and are expected to disappear only at late G spectral types.
3.2.4. Na I and Ca I lines
The Na I lines at 2.2056 μm and 2.2084 μm and the Ca I lines at 2.2608 μm + 2.0796 μm + 2.0836 μm are clear signatures of cool stars (spectral type G or later). They are generally absent in the spectra of our OB2 calibrator stars. We note that one of our calibrator stars shows the 2.2056 μm Na I line in absorption, but this line is very narrow (much less broad than the other lines), suggesting an interstellar origin for the absorption.
3.2.5. CO band heads
The CO ro-vibrational bands, with their band heads at 2.2935 μm for the v = 2−0 transitions, 2.3227 μm for the v = 3−1 transitions, and 2.3535 μm for the v = 4−2 transitions, constitute very prominent absorption features in cool stars. They are generally seen at spectral types later than mid G. None of our OB2 calibrator spectra show these band heads.
3.3. Spectral type determination for the O- and early B-type stars
Spectral classification of early-type stars in the infrared regime is less reliable than in the optical (see Gray & Corbally 2009), mostly because the lines in the NIR regime are often formed in higher atmospheric layers than the optical lines. In particular, the equivalent width of the H and He lines in hot stars not only depends on the effective temperature, but is also strongly influenced by the surface gravity and the detailed properties of the (generally very strong) stellar winds (see, e.g., Hanson et al. 2005; Repolust et al. 2005). Nevertheless, the He lines show a systematic increase or decrease in line strength with spectral type, which allows spectral types to be reasonably well determined.
The general trends of decreasing line strengths with increasing temperature for the H and He I lines and the increasing line strengths with increasing temperature for the He II lines are clearly seen in the spectra of our calibrator stars, although with a substantial scatter. Given the moderate spectral resolution of our spectra and the limited number of just four diagnostic He lines we can use, we do not aim at a very detailed and highly accurate spectra modeling but instead restrict our analysis to estimating spectral types with an accuracy of about two subtypes.
For all the stars in our samples that showed clear He lines, we analyzed the strengths of the diagnostic lines described below to determine their spectral type as accurately as possible. In order to avoid biases in the classification procedure, we did our classification for all KMOS spectra (i.e., including those stars for which a spectral type was already known from the literature). For stars that were observed twice, the classification was also done twice. The analysis was also done in a “blind” way, that is, without taking the literature information into account. Only after finishing the classification did we check the corresponding literature values, and we compared our two independent spectral types for those stars that were observed twice. We generally found rather good agreement (within about two subtypes) in all cases.
3.4. Excluding the presence of Red Supergiants
As described above, we consider cool stars to be either foreground field stars or background giants, in any case unrelated to the Carina Nebula. However, a potential complication arises from the fact that some evolved massive stars spend a small fraction of time near the end of their lifetimes as red supergiants (RSGs) and display (very) cool spectra in this phase. Young stellar populations with ages of at least about 10 Myr can thus contain RSGs. Although it appears likely that the stars in Tr 16-SE are too young to be RSGs (the oldest age of the well-studied clusters in the Carina Nebula is 8 Myr [for Tr 15]; see Preibisch et al. 2011a), this possibility should not be a priori excluded. Therefore, we checked whether the cool stars might possibly be RSGs in the Carina Nebula.
For this, we used the fact that RSGs generally have bolometric luminosities of ≳104 L⊙ and employed the magnitude-luminosity calibration for RSGs derived by Davies et al. (2013a). Although the (unknown) extinction toward our target stars is a possible complication, it is not a very serious one for the purposes of our estimates for two reasons: First, we work in the infrared, and the extinction in the K-band is almost a factor of ten lower than in the optical. Second, from the color-color diagram of our target stars as well as from the cloud column density maps from our previous APEX/LABOCA submillimeter and Herschel far-infrared maps, we know that the cloud extinction in TR 16-SE ranges from values of just a few magnitudes to about 15 magnitudes in optical extinction, corresponding to AK values of ≲1.5 mag. Since the minimal luminosity of RSGs is ≈104 L⊙, this implies that, even for an extinction of AV ≈ 15 mag, all possible RSGs should be brighter than K ≈ 5.7. We note that this value is consistent with corresponding estimates based on the K-band bolometric corrections for cool stars from Buzzoni et al. (2010); thus, this magnitude limit is robust.
All our target stars have K-band magnitudes > 6.74 (and > 7.7 for all but the two brightest stars). We can therefore conclude that even the brightest stars in our sample are substantially fainter (by more than one magnitude in the K-band) than the expected magnitudes of even the faintest RSGs in the Carina Nebula. The cool stars in our sample must therefore be either foreground stars or giants (and perhaps RSGs) in the galactic background.
3.5. Results of the spectral classification
Our spectral typing results for each target star are listed in Table B.1. The statistics as a function of spectral types are as follows.
Three stars are classified as “early O-type stars” (≤ O5): B8 (O5-6), B13 (O5), and B14 (O5). One of these, B13 = V662 Car = MJ 596, was known before our observation to be a double-lined O5.5V+O9.5V spectroscopic binary (Niemela et al. 2006) and was reclassified to a spectral type of O5Vz+B0:V by Alexander et al. (2016).
Three stars (B5, F3, and B7) are classified as “mid O-type stars” (O6–O7). We note that for our target star, B5, an optically determined spectral type of O6 V became available in the literature (Alexander et al. 2016) after our KMOS observations.
One star (F8) is classified as a “late O-type star” (O8–O9), five stars (F7, B12, B18, F22, and B21) as “late O- to early B-type stars” (O9–B1), and three stars (F9, F16, and F17) as “early B-type stars” (B0–B2). Eight stars (F10, F11, F12-2, B11, F14, B16, B17, and F21) are classified as “likely AeBe stars” (i.e., intermediate-mass pre-main-sequence stars).
The total combined number of OB2 and likely AeBe stars in the Tr 16-SE region is thus 23 (15 plus eight). We note that one of the three target stars outside Tr 16-SE, C17 in Tr 16, is also classified as a likely AeBe star.
The spectra of 18 stars in Tr 16-SE showed no indications of He lines but clear signatures of cool photospheres (e.g., CO absorption and/or Na and Ca line absorption), and are thus classified as cool stars. Six stars (F4, F12-1, F13, F15, B22, and B23) could not be reliably classified; some of them may be late B- or A-type stars.
4. Comparison to previous OB-candidate samples and photometric spectral type estimates
Povich et al. (2011) used photometry from 2MASS and Spitzer to analyze the spectral energy distributions (SEDs) of infrared sources in the Carina Nebula. In Tr 16-SE, they identified six stars (their OBc 48, 50, 51, 52, 56, and 61) as candidate OB stars based on their observed SED. All six of these stars are in our sample, and all of them are classified as O-type or early B-type stars in our independent spectroscopic analysis. This shows that the SED-based classification of OB candidate stars performed by Povich et al. (2011) worked very well and yielded reliable results.
In addition to the six OB candidates from Povich et al. (2011), our spectroscopic survey yields a further nine OB2 stars that were not in their OB-candidate sample. One of these is the previously known O5 star MJ 596, and our analysis (see below) suggests that six of these additional OB2 stars are background objects. However, two of these additional OB2 stars (B12 and B18, both classified as O9–B1 stars) are found to be members of Tr 16-SE. This shows that, as expected, the sample of SED-selected OB candidates from Povich et al. (2011) is not 100% complete; considering our results, the level of completeness is estimated to be 6/8 = 75%.
For several of our target stars, Mohr-Smith et al. (2017) reported spectral type estimates based on an analysis of their optical-infrared SED5 after our KMOS observations. We compared their spectral type estimate to our KMOS spectroscopic classifications and found generally rather good agreement, typically within one or two subtypes.
5. Clues on stellar distances from Gaia data
As mentioned in Sect. 2.1, our target stars were selected based only on their position on the sky and a limit on their Ks-band magnitude. Our target sample therefore contains not only stars in the Carina Nebula, but also some foreground and background stars. The Gaia mission (Gaia Collaboration 2016) has recently determined parallax values for many of our target stars, providing very important distance information (which was not available at the time of our observations). We therefore checked whether we can use the Gaia data to identify foreground or background stars in our sample. This requires a good knowledge of the distance to the Carina Nebula and Tr 16-SE.
5.1. The distance to the Carina Nebula
As described in Smith & Brooks (2008), the pre-Gaia distance to the central region of the Carina Nebula is well known to be 2.3 kpc. Since the projected extent of the whole Carina Nebula cloud complex is about 100 pc (Preibisch et al. 2012, 2017), different parts of the complex may well be about 100 pc closer or more distant.
Although the Gaia data offer a good opportunity to investigate the distances in a new and independent way, the typical uncertainties of the Gaia Early Data Release 3 (EDR3) parallaxes and proper motions for most stars in the Carina Nebula are still too large to allow a purely astrometric identification of the Carina Nebula association members. One therefore needs a preselected sample of member candidates to determine distances with the Gaia data. Using the Gaia DR2 data, Povich et al. (2019) presented a determination of the distance to the large sample of > 10 000 X-ray selected stars in the Carina Nebula from the CCCP project (see Broos et al. 2011) and found a value of  kpc, slightly higher than but still consistent with the previous “canonical” value of 2.3 kpc.
Taking advantage of the recently released Gaia EDR3 data (see Gaia Collaboration 2021), which provide improved accuracy of the astrometric parameters, we determined the mean value of the parallaxes of the 10 714 X-ray selected “likely Carina member stars” from the CCCP project; this yielded ⟨ϖ⟩ = 0.4347 mas, corresponding to a distance of ≈2.30 kpc, in very good agreement with the pre-Gaia distance value.
5.2. Gaia distances of the KMOS target stars
For 58 of the stars observed with KMOS, we could find a Gaia EDR3 match within a search radius of one arcsecond. For six stars, the listed parallaxes are negative (i.e., provide no useful information about the distance). The uncertainties of the Gaia parallaxes of our KMOS target stars range from σϖ = 0.0102 mas up to σϖ = 0.5119 mas.
Assuming that the stars in the Carina Nebula are in the distance range between ≈2.2 kpc and ≈2.8 kpc, we can check how consistent the parallax of individual KMOS target stars is with this distance range. For the large majority of our KMOS target stars, the [ϖ±3σϖ] interval overlaps with the ![Mathematical equation: $ \left[ \frac{1}{2.8} - \frac{1}{2.2} \right] $](/articles/aa/full_html/2021/04/aa39620-20/aa39620-20-eq2.gif) mas range; we consider the parallaxes of these stars as being consistent with membership in the Carina Nebula.
mas range; we consider the parallaxes of these stars as being consistent with membership in the Carina Nebula.
5.3. Foreground stars
We consider stars as “likely foreground stars” if their 3σ lower bound of the measured parallax is  mas, and as “clear foreground stars” if their 5σ lower bound of the measured parallax is
  mas. According to these definitions, five of our target stars are clear foreground stars: B3 = C21 (1/ϖ = 1442 pc), B4 = C22 (1/ϖ = 389 pc), B22 (1/ϖ = 486 pc), B23 (1/ϖ = 1398 pc), and F24 (1/ϖ = 1337 pc). In addition, the two target stars C18 (1/ϖ = 1991 pc) and F23 (1/ϖ = 1934 pc) are likely foreground stars.
In our KMOS spectral classification, the Gaia-based foreground stars B3, F24, and C18 were classified as cool stars, B4 as a spectral type between F and G, and B22 and B23 as possible B- or A-type stars; these spectral types are consistent with their nature as field stars in the foreground. None of the OB2 stars in our KMOS sample have Gaia parallaxes that would suggest their being foreground stars.
5.4. Background stars
A similar attempt to identify possible background stars was not successful. Although a couple of stars have suspiciously small parallaxes (ϖ < 0.2 mas), the 5σ interval still overlaps with the [2.2−2.8] kpc Carina Nebula distance range for all stars. Therefore, none of our target stars can be reliably classified as background stars based on their Gaia parallaxes. We note that it is very likely that some of our target stars actually are in the background (e.g., as red giants), but the accuracy of the current Gaia parallaxes is just not (yet) good enough to prove this directly from their parallaxes.
6. Properties of the OB2 stars
Since the Gaia data cannot reliably discern stars in TR 16-SE from objects in the galactic background, we need an alternative way to identify possible background stars in our OB2 sample. We therefore calculated the extinction, the absolute K-band magnitude, and, from this, the bolometric magnitude for an assumed distance of 2.3 kpc. The corresponding luminosity estimate is then compared to the expected luminosity of main-sequence stars of this spectral type; if both values agree within a factor of two, we assume the observed stellar properties to be consistent with membership in the Carina Nebula.
We determined the extinction from the H − Ks color excess. For the O-type stars, we assumed the intrinsic colors listed in (Martins et al. 2005) and then used the bolometric corrections BCK from Martins & Plez (2006) to calculate absolute magnitudes and luminosities for D = 2.3 kpc. For the early B-type stars, we used the intrinsic colors and bolometric corrections from Pecaut & Mamajek (2013). The calculated luminosities L[2.3 kpc] were then compared to the luminosities listed for the corresponding spectral types in Smith (2006).
We found K-band extinction values between 0.64 mag and 1.60 mag, corresponding to visual extinction values of AV ∼ [5.8−14.5] mag for the O-type stars in Tr 16-SE. For the O-type stars in Tr 16, which we observed as spectral calibrators, a similar analysis yielded K-band extinction values between 0.24 mag and 0.44 mag, corresponding to visual extinctions of AV ∼ [2.2−4] mag.
For nine of the 15 OB2 stars in Tr 16-SE, our luminosity estimates are consistent with their being stars in the Carina Nebula complex, and these stars are thus denoted as “Tr 16-SE members” in Table 4. However, for three O-type stars and three early B-type stars, the computed bolometric luminosity for D = 2.3 kpc is more than a factor of 2.5 lower than the expected luminosity for main-sequence stars of this spectral type; these are denoted as “background stars” in Table 4.
Properties of the OB2 stars in the Tr 16-SE region.
7. The stellar population of Tr 16-SE
In Fig. 2 we show the spatial distribution and spectral classifications of our KMOS target stars. We find a clear concentration of OB2 cluster members near the center of the cluster, which is located roughly at the position of the O5 star MJ 596.
 |
Fig. 2. Map showing the spatial distribution of our KMOS target stars in celestial coordinates. O-type stars are denoted by violet star symbols, early B-type stars with light blue star symbols, (Ae)Be stars with green triangles, and late-type stars with light red circles. The previously known O-type star MJ 596 near the center of the cluster is denoted by an empty diamond (superimposed onto the star symbol). The OB2 stars that we classified as background stars are shown with yellow-filled star symbols. Stars that could not be classified are shown as small crosses, and the OB calibrator stars in Tr 16 are shown with small dark blue diamonds. The position of η Car at the top edge of the map is also indicated. |
In Fig. 3 we show the NIR color-color diagram of the KMOS target stars. It shows that all OB2 stars show extinction values of more than AV ≥ 5 mag, clearly suggesting them to be located in or (more likely) behind the clouds that obscure Tr 16-SE, as expected. While none of the OB2 stars show evidence for an infrared excess, we note that many (Ae)Be stars do clearly show infrared excesses, as expected for such young stellar objects. Most of the cool stars show high extinction values (AV ≥ 10 mag), as expected for background objects that are seen through the clouds obscuring Tr 16-SE.
 |
Fig. 3. Near-infrared color-color diagram of the KMOS target stars. The solid lines show the color of the main-sequence and giant stars, the arrow shows an AV = 10 mag reddening vector with slope 1.85 (see Zeidler et al. 2016), and the thick dashed line marks the separation between the photospheric reddening band (above this line) and the infrared excess region (below this line). Symbols and colors for the stars are the same as in Fig. 2. |
In Fig. 4 we show an NIR color-magnitude diagram of the KMOS target stars. The locations of the different groups in this diagram are consistent with their spectral classification, which also suggests that a large fraction of the cool stars in our KMOS sample must be red giant stars in the galactic background.
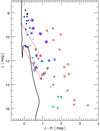 |
Fig. 4. J versus J − H color-magnitude diagram of the KMOS target stars. The solid black line shows a 1 Myr isochrone based on the PARSEC stellar models (see Bressan et al. 2012). The arrows indicate reddening vectors for AV = 10 mag starting at the location of 10 Myr old stars with masses of 20 M⊙ and 8 M⊙. Symbols and colors for the stars are the same as in Fig. 2. |
8. Tr 16-SE and the pillar G 287.75–0.66
The Spitzer image in Fig. 5 shows the spatial relation between the pillar G 287.75−0.66 and the stars in Tr 16-SE. It shows a bright infrared source located directly at the tip of the pillar. Optical images also show a bright (V = 13.14) star (MJ 633) at the pillar tip. This star may thus appear as the “prime suspect” for the radiation source creating and shaping the pillar. However, a detailed inspection of optical6 and infrared7 images with subarcsecond angular resolution clearly shows that the bright infrared source does not coincide with the optical star MJ 633: There are two distinct sources with an angular separation of 1.8″. The star MJ 633 is seen as a bright object in the optical image and as a moderately bright object in the NIR image at a consistent position of α(J2000) = 10h45m54.807s, δ(J2000) = − 59° 48′15.56″.
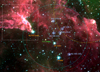 |
Fig. 5. Spitzer Infrared Array Camera (IRAC) color-composite image of Tr 16-SE and the pillar G 287.75−0.66; the image is composed of the 3.6 μm image in the blue color channel, the 4.2 μm image in the green color channel, and the 5.8 μm image in the red color channel. North is up, and east is to the left. The white 4′ × 4′ square marks the region of the pillar G 287.75−0.66, and the circles show the KMOS patrol fields for the B (blue), F (red), and C (yellow) observations. North is up, and east is to the left. The early O-type stars in Tr 16-SE are marked by the empty violet star symbols; their names and spectral types are given in the annotation. Furthermore, some of the brightest infrared sources (including the S-type star 2MASS J10453185-5951094) are annotated. |
The position of the bright infrared source measured in our HAWK-I image is α(J2000) = 10h45m54.575s, δ(J2000) = − 59° 48′15.1″; it can be identified with the 2MASS point source J10455458-5948150. This object is also a bright mid-infrared source detected by Mottram et al. (2007) and classified as a massive young stellar object candidate with the designation G 287.7441−00.6869 1. In the optical image, the infrared source is seen as a very faint brightness enhancement in the wings of the PSF of the (optically) much brighter star MJ 633.
In our KMOS observations we obtained spectra of both stars. Our KMOS spectra of the optically visible star MJ 633 (=target F24) show no He I or He II lines, but do show clear CO band head absorption as well as Na and Ca absorption lines. This clearly suggests that MJ 633 is a cool star. Furthermore, the Gaia EDR3 parallax of ϖ = 0.7480 ± 0.0127 mag corresponds to a distance of D = 1.337 [1.314−1.360] kpc and shows that this star is a foreground object, unrelated to the Carina Nebula. It is just a random projection effect that puts this star apparently at the tip of the pillar.
Our KMOS spectra of the optically invisible infrared-bright star J10455458-5948150 (i.e., target B24) also show no clear signs of He I or He II lines, but do show CO band head absorption as well as Na and Ca absorption, clearly suggesting a cool photosphere. We conclude that the previous classification of this source as a massive young stellar object candidate by Mottram et al. (2007) is not confirmed by our spectra. However, since our spectrum shows the Bracket γ line to be in emission, the object may well be a young stellar object, though not a massive one.
In conclusion, the two stars seen apparently at the tip of the pillar are either unrelated to the Carina Nebula or are not luminous enough to be responsible for producing the pillar. The visual impression that one of these stars is the irradiating source of the pillar is purely a random projection effect.
In Fig. 5 we mark and annotate the early O-type stars in Tr 16-SE; as the emitted stellar UV luminosity is steeply increasing with effective temperature, we only consider the five stars in Tr 16-SE with spectral types between O5 and O6. These five O5-O6 stars are located at projected distances between ≈1.7 pc and ≈3.1 pc from the pillar; their combined UV irradiation may have shaped the pillar G 287.75−0.66.
9. Conclusions and summary
Our KMOS observations of a magnitude-limited sample of possible OB stars in the obscured cluster Tr 16-SE led to the identification of five stars with spectral types between O5 and O7 (only two of which were known before) and four new stars with spectral types between O9 and B1 as members of Tr 16-SE. With at least five O-type stars and a further four late O- or early B-type stars, Tr 16-SE is one of the larger clusterings of high-mass stars in the Carina Nebula; its high-mass stellar population is smaller than the prominent open clusters Tr 14, 15, and 16 (each of which contains ≥15 OB2 stars) but is comparable to or larger than the clusters Bochum 10 (15 OB2 stars) and Bochum 11 (seven OB2 stars). Tr 16-SE therefore constitutes a significant, but so far overlooked, part of the massive cluster population in the Carina Nebula complex.
Our newly identified O-type stars in Tr 16-SE significantly increase the census of spectroscopically identified O-type stars in the Carina Nebula (previously 70 stars). Another very important result is the fact that all six of the OB candidates in Tr 16-SE from Povich et al. (2011) are spectroscopically confirmed as OB2 stars by our KMOS observations. This suggests that the large majority of their 94 OB candidates in the full area of the Carina Nebula are most likely true OB2 stars.
Assuming a ≈75% completeness for the Povich et al. (2011) OB-candidate sample (see Sect. 4), this suggests that that the Carina Nebula probably contains ≈(94−6)/0.75 ≈ 117 further OB2 stars awaiting spectroscopic confirmation. The total OB2 star population in the Carina Nebula may well be twice as large as the presently identified sample.
We excluded the star BM VII 10 (= 2MASS J10453185-5951094) because it is known to be an S star (see Van Eck et al. 2000), i.e., a cool giant, and would have been much too bright (Ks = 5.0) for our observations.
The possibility of RSG stars (i.e., evolved massive stars) will be addressed in Sect. 3.4.
We note that Mohr-Smith et al. (2017) also obtained optical spectra of some of their target stars, but none of these spectrally observed stars are located in the area of our TR 16-SE KMOS observations.
We used a 25 s exposure r_SDSS-band image obtained with the ESO VLT Survey Telescope (file name OMEGA.2012-02-15T05:34:43.880.fits) that was obtained as part of the VST Photometric H-α Survey of the Southern Galactic Plane (see Drew et al. 2014); it has an image scale of 0.21″ per pixel and the FWHM of the PSF is ≈0.8″.
We used our 720 sec exposure J-band image obtained with HAWK-I at the ESO VLT (see Preibisch et al. 2011b), which provides an angular resolution of ≈0.5″.
Acknowledgments
We thank Rolf Kudritzki and Joachim Puls for enlightening discussion about the spectra of massive stars. The LMU Bachelor Physics student D. Beckord provided assistance in the construction of the initial spectral line catalog. The research of T.P. and B.E. was partly supported by the Excellence Cluster ORIGINS which is funded by the Deutsche Forschungsgemeinschaft (DFG, German Research Foundation) under Germany’s Excellence Strategy – EXC-2094 – 390783311. This work has made use of data from the European Space Agency (ESA) mission Gaia (https://www.cosmos.esa.int/gaia), processed by the Gaia Data Processing and Analysis Consortium (DPAC, https://www.cosmos.esa.int/web/gaia/dpac/consortium). Funding for the DPAC has been provided by national institutions, in particular the institutions participating in the Gaia Multilateral Agreement.
References
- Alexander, M. J., Hanes, R. J., Povich, M. S., & McSwain, M. V. 2016, AJ, 152, 190 [Google Scholar]
- Bressan, A., Marigo, P., Girardi, L., et al. 2012, MNRAS, 427, 127 [NASA ADS] [CrossRef] [Google Scholar]
- Broos, P. S., Getman, K. V., Povich, M. S., et al. 2011, ApJS, 194, 4 [NASA ADS] [CrossRef] [Google Scholar]
- Buzzoni, A., Patelli, L., Bellazzini, M., Pecci, F. F., & Oliva, E. 2010, MNRAS, 403, 1592 [NASA ADS] [CrossRef] [Google Scholar]
- Coccato, L., Freudling, W., Smette, A., et al. 2019, Messenger, 177, 14 [Google Scholar]
- Dale, J. E., Ercolano, B., & Bonnell, I. A. 2013, MNRAS, 430, 234 [NASA ADS] [CrossRef] [MathSciNet] [Google Scholar]
- Damiani, F., Klutsch, A., Jeffries, R. D., et al. 2017, A&A, 603, A81 [NASA ADS] [CrossRef] [EDP Sciences] [Google Scholar]
- Davies, R. I., Agudo Berbel, A., Wiezorrek, E., et al. 2013a, A&A, 558, A56 [NASA ADS] [CrossRef] [EDP Sciences] [Google Scholar]
- Davies, B., Kudritzki, R.-P., Plez, B., et al. 2013b, ApJ, 767, 3 [NASA ADS] [CrossRef] [Google Scholar]
- Drew, J. E., Gonzalez-Solares, E., Greimel, R., et al. 2014, MNRAS, 440, 2036 [NASA ADS] [CrossRef] [Google Scholar]
- Feigelson, E. D., Getman, K. V., Townsley, L. K., et al. 2011, ApJS, 194, 9 [NASA ADS] [CrossRef] [Google Scholar]
- Freudling, W., Romaniello, M., Bramich, D. M., et al. 2013, A&A, 559, A96 [NASA ADS] [CrossRef] [EDP Sciences] [Google Scholar]
- Gaia Collaboration (Prusti, T., et al.) 2016, A&A, 595, A1 [NASA ADS] [CrossRef] [EDP Sciences] [Google Scholar]
- Gaia Collaboration (Brown, A. G. A., et al.) 2021, A&A, in press, https://doi.org/10.1051/0004-6361/202039657 [Google Scholar]
- Gray, R. O., & Corbally, C. J. 2009, in Stellar Spectral Classification (Princeton University Press) [Google Scholar]
- Gritschneder, M., Burkert, A., Naab, T., & Walch, S. 2010, ApJ, 723, 971 [NASA ADS] [CrossRef] [Google Scholar]
- Hanes, R. J., McSwain, M. V., & Povich, M. S. 2018, AJ, 155, 190 [Google Scholar]
- Hanson, M. M., Kudritzki, R.-P., Kenworthy, M. A., Puls, J., & Tokunaga, A. T. 2005, ApJS, 161, 154 [NASA ADS] [CrossRef] [EDP Sciences] [MathSciNet] [Google Scholar]
- Herbig, G. H. 1994, in The Nature and Evolutionary Status of Herbig Ae/Be Stars, eds. P. S. The, M. R. Perez, & E. P. J. van den Heuvel, ASP Conf. Ser., 62, 3 [Google Scholar]
- Kiminki, M. M., & Smith, N. 2018, MNRAS, 477, 2068 [NASA ADS] [CrossRef] [Google Scholar]
- Klaassen, P. D., Reiter, M. R., McLeod, A. F., et al. 2020, MNRAS, 491, 178 [Google Scholar]
- Martins, F., & Plez, B. 2006, A&A, 457, 637 [NASA ADS] [CrossRef] [EDP Sciences] [Google Scholar]
- Martins, F., Schaerer, D., & Hillier, D. J. 2005, A&A, 436, 1049 [NASA ADS] [CrossRef] [EDP Sciences] [Google Scholar]
- Massey, P., & Johnson, J. 1993, AJ, 105, 980 [NASA ADS] [CrossRef] [Google Scholar]
- McLeod, A. F., Gritschneder, M., Dale, J. E., et al. 2016, MNRAS, 462, 3537 [NASA ADS] [CrossRef] [Google Scholar]
- Mohr-Smith, M., Drew, J. E., Napiwotzki, R., et al. 2017, MNRAS, 465, 1807 [NASA ADS] [CrossRef] [Google Scholar]
- Mottram, J. C., Hoare, M. G., Lumsden, S. L., et al. 2007, A&A, 476, 1019 [NASA ADS] [CrossRef] [EDP Sciences] [Google Scholar]
- Niemela, V. S., Morrell, N. I., Fernández Lajús, E., et al. 2006, MNRAS, 367, 1450 [NASA ADS] [CrossRef] [Google Scholar]
- Pecaut, M. J., & Mamajek, E. E. 2013, ApJS, 208, 9 [Google Scholar]
- Povich, M. S., Townsley, L. K., Broos, P. S., et al. 2011, ApJS, 194, 6 [NASA ADS] [CrossRef] [Google Scholar]
- Povich, M. S., Maldonado, J. T., Haze Nuñez, E., & Robitaille, T. P. 2019, ApJ, 881, 37 [CrossRef] [Google Scholar]
- Preibisch, T., Schuller, F., Ohlendorf, H., et al. 2011a, A&A, 525, A92 [NASA ADS] [CrossRef] [EDP Sciences] [Google Scholar]
- Preibisch, T., Ratzka, T., Kuderna, B., et al. 2011b, A&A, 530, A34 [NASA ADS] [CrossRef] [EDP Sciences] [Google Scholar]
- Preibisch, T., Hodgkin, S., Irwin, M., et al. 2011c, ApJS, 194, 10 [NASA ADS] [CrossRef] [Google Scholar]
- Preibisch, T., Roccatagliata, V., Gaczkowski, B., & Ratzka, T. 2012, A&A, 541, A132 [NASA ADS] [CrossRef] [EDP Sciences] [Google Scholar]
- Preibisch, T., Zeidler, P., Ratzka, T., Roccatagliata, V., & Petr-Gotzens, M. G. 2014, A&A, 572, A116 [NASA ADS] [CrossRef] [EDP Sciences] [Google Scholar]
- Preibisch, T., Flaischlen, S., Gaczkowski, B., Townsley, L., & Broos, P. 2017, A&A, 605, A85 [EDP Sciences] [Google Scholar]
- Rebolledo, D., Burton, M., Green, A., et al. 2016, MNRAS, 456, 2406 [NASA ADS] [CrossRef] [Google Scholar]
- Repolust, T., Puls, J., Hanson, M. M., Kudritzki, R. P., & Mokiem, M. R. 2005, A&A, 440, 261 [NASA ADS] [CrossRef] [EDP Sciences] [Google Scholar]
- Roccatagliata, V., Preibisch, T., Ratzka, T., & Gaczkowski, B. 2013, A&A, 554, A6 [NASA ADS] [CrossRef] [EDP Sciences] [Google Scholar]
- Sanchawala, K., Chen, W.-P., Lee, H.-T., et al. 2007, ApJ, 656, 462 [NASA ADS] [CrossRef] [Google Scholar]
- Sharples, R., Bender, R., Agudo Berbel, A., et al. 2013, Messenger, 151, 21 [Google Scholar]
- Smith, N. 2006, MNRAS, 367, 763 [NASA ADS] [CrossRef] [Google Scholar]
- Smith, N., & Brooks, K. J. 2008, in The Carina Nebula: A Laboratory for Feedback and Triggered Star Formation, ed. B. Reipurth (Astronomical Society of the Pacific), ASP Monogr. Publ., 5, 138 [Google Scholar]
- Smith, N., Povich, M. S., Whitney, B. A., et al. 2010, MNRAS, 406, 952 [Google Scholar]
- Sota, A., Maíz Apellániz, J., Morrell, N. I., et al. 2014, ApJS, 211, 10 [Google Scholar]
- Stoehr, F., White, R., Smith, M., et al. 2008, in DER_SNR: A Simple & General Spectroscopic Signal-to-Noise Measurement Algorithm, eds. R. W. Argyle, P. S. Bunclark, J. R. Lewis, et al. (Astronomical Society of the Pacific), ASP Conf. Ser., 394, 505 [Google Scholar]
- Townsley, L. K., Broos, P. S., Corcoran, M. F., et al. 2011, ApJS, 194, 1 [NASA ADS] [CrossRef] [EDP Sciences] [Google Scholar]
- Van Eck, S., Jorissen, A., Udry, S., et al. 2000, A&AS, 145, 51 [NASA ADS] [CrossRef] [EDP Sciences] [Google Scholar]
- Zeidler, P., Preibisch, T., Ratzka, T., Roccatagliata, V., & Petr-Gotzens, M. G. 2016, A&A, 585, A49 [NASA ADS] [CrossRef] [EDP Sciences] [Google Scholar]
Appendix A: Spectra
Figures A.1–A.6 show the normalized KMOS spectra of all our targets.
 |
Fig. A.1. H-band spectra in the B sample. |
 |
Fig. A.2. H-band spectra in the C sample. |
 |
Fig. A.3. H-band spectra in the F sample. |
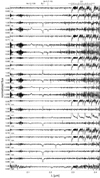 |
Fig. A.4. K-band spectra in the B sample. |
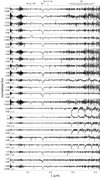 |
Fig. A.5. K-band spectra in the C sample. |
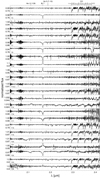 |
Fig. A.6. K-band spectra in the F sample. |
Appendix B: Additional table
Target positions and results.
All Tables
All Figures
|
Fig. 1. Optical and infrared images of the central part of the Carina Nebula. Left: optical image reproduced from the ESO Photo Release eso1250 (image credit: VPHAS+ Consortium/Cambridge Astronomical Survey Unit). It is composed of a B-band image in the blue color channel, a g-band image in the green color channel, and r-band and Hα-band images in the red color channel. The white box marks the region around the pillar G 287.75−0.66 (which is not visible in this optical image). The dashed yellow circle marks the region of the obscured cluster Tr 16-SE and the dashed blue ellipse the cluster Tr 16. The positions of the stars MJ 596, MJ 633, and η Car are marked. North is up, and east is to the left. Right: color composite image of the region around the pillar, composed from our VISTA Ks-band image in blue, the Spitzer 5.8 μm image in green (where the area around η Car [near the upper right corner] is affected by saturation), and our LABOCA 870 μm map in red. The white 4′ × 4′ square marks the region of the pillar G 287.75−0.66, and the circles show the KMOS patrol fields for the B (blue), F (orange), and C (white) observations. North is up, and east is to the left. |
| In the text | |
|
Fig. 2. Map showing the spatial distribution of our KMOS target stars in celestial coordinates. O-type stars are denoted by violet star symbols, early B-type stars with light blue star symbols, (Ae)Be stars with green triangles, and late-type stars with light red circles. The previously known O-type star MJ 596 near the center of the cluster is denoted by an empty diamond (superimposed onto the star symbol). The OB2 stars that we classified as background stars are shown with yellow-filled star symbols. Stars that could not be classified are shown as small crosses, and the OB calibrator stars in Tr 16 are shown with small dark blue diamonds. The position of η Car at the top edge of the map is also indicated. |
| In the text | |
|
Fig. 3. Near-infrared color-color diagram of the KMOS target stars. The solid lines show the color of the main-sequence and giant stars, the arrow shows an AV = 10 mag reddening vector with slope 1.85 (see Zeidler et al. 2016), and the thick dashed line marks the separation between the photospheric reddening band (above this line) and the infrared excess region (below this line). Symbols and colors for the stars are the same as in Fig. 2. |
| In the text | |
|
Fig. 4. J versus J − H color-magnitude diagram of the KMOS target stars. The solid black line shows a 1 Myr isochrone based on the PARSEC stellar models (see Bressan et al. 2012). The arrows indicate reddening vectors for AV = 10 mag starting at the location of 10 Myr old stars with masses of 20 M⊙ and 8 M⊙. Symbols and colors for the stars are the same as in Fig. 2. |
| In the text | |
|
Fig. 5. Spitzer Infrared Array Camera (IRAC) color-composite image of Tr 16-SE and the pillar G 287.75−0.66; the image is composed of the 3.6 μm image in the blue color channel, the 4.2 μm image in the green color channel, and the 5.8 μm image in the red color channel. North is up, and east is to the left. The white 4′ × 4′ square marks the region of the pillar G 287.75−0.66, and the circles show the KMOS patrol fields for the B (blue), F (red), and C (yellow) observations. North is up, and east is to the left. The early O-type stars in Tr 16-SE are marked by the empty violet star symbols; their names and spectral types are given in the annotation. Furthermore, some of the brightest infrared sources (including the S-type star 2MASS J10453185-5951094) are annotated. |
| In the text | |
|
Fig. A.1. H-band spectra in the B sample. |
| In the text | |
|
Fig. A.2. H-band spectra in the C sample. |
| In the text | |
|
Fig. A.3. H-band spectra in the F sample. |
| In the text | |
|
Fig. A.4. K-band spectra in the B sample. |
| In the text | |
|
Fig. A.5. K-band spectra in the C sample. |
| In the text | |
|
Fig. A.6. K-band spectra in the F sample. |
| In the text | |
Current usage metrics show cumulative count of Article Views (full-text article views including HTML views, PDF and ePub downloads, according to the available data) and Abstracts Views on Vision4Press platform.
Data correspond to usage on the plateform after 2015. The current usage metrics is available 48-96 hours after online publication and is updated daily on week days.
Initial download of the metrics may take a while.