Free Access
Fig. 9
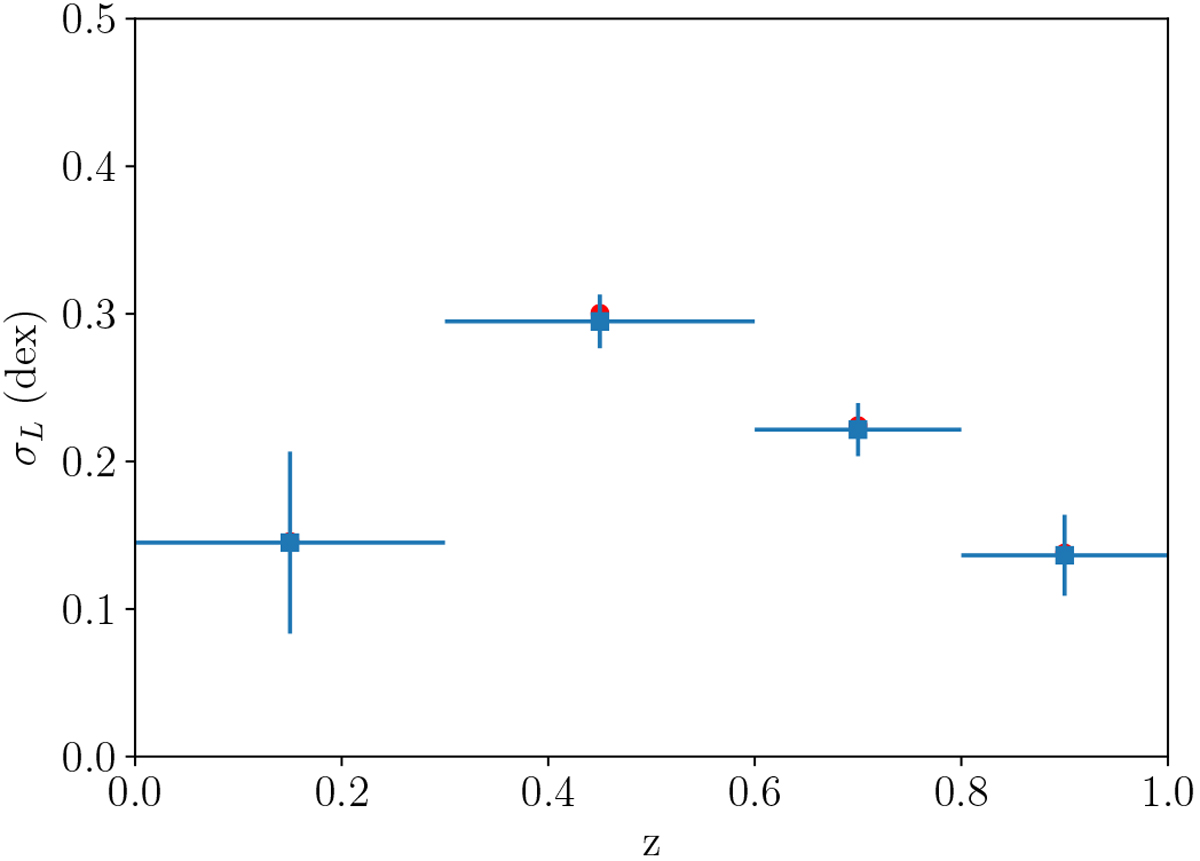
Variation in σL for galaxies with 0.5 < log10ψ < 1.5, 10 < log10(M∕M⊙) < 11 as a function of redshift – with error bars derived from the 16th and 84th percentiles of the PDF – and centred on the median-likelihood values. The error bars in the redshift (horizontal) direction indicate the bounds of each redshift bin.
Current usage metrics show cumulative count of Article Views (full-text article views including HTML views, PDF and ePub downloads, according to the available data) and Abstracts Views on Vision4Press platform.
Data correspond to usage on the plateform after 2015. The current usage metrics is available 48-96 hours after online publication and is updated daily on week days.
Initial download of the metrics may take a while.