Fig. 8
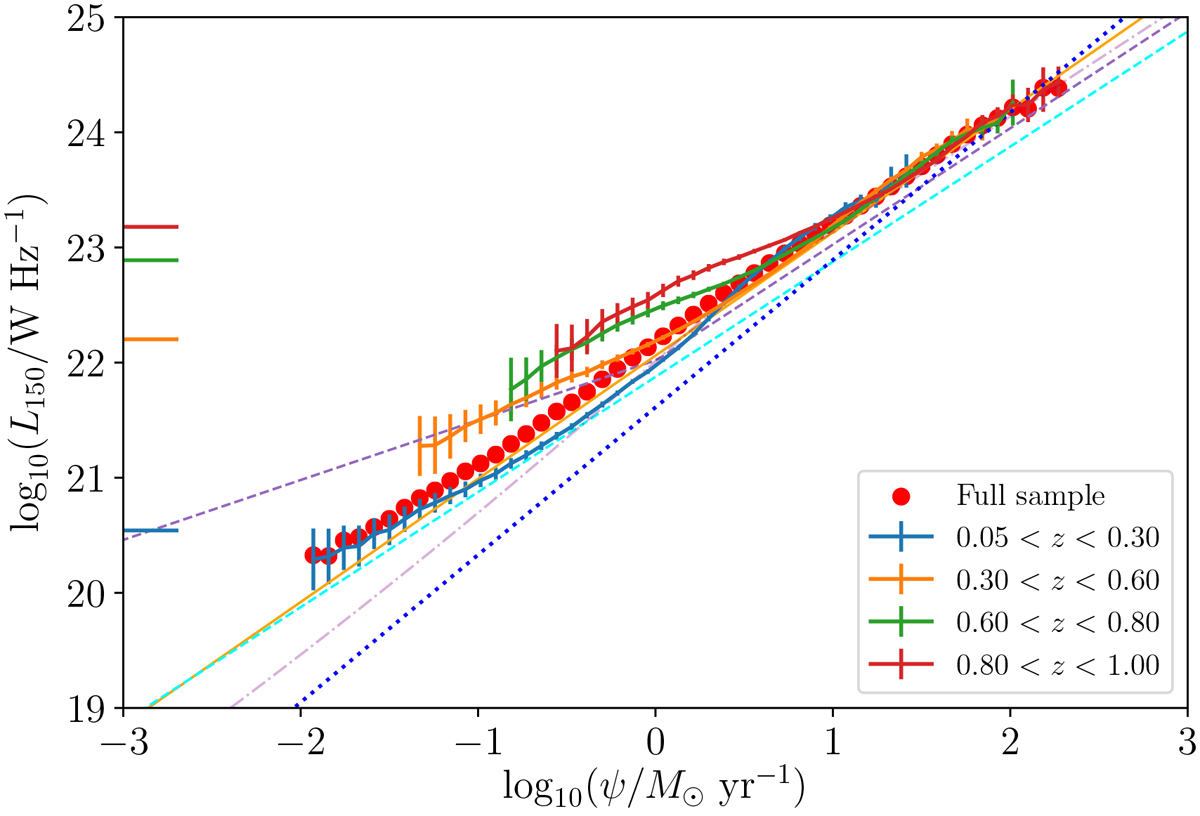
Median-likelihood estimates of the SFR-L150 MHz relation for the wholesample (red circles) and in four redshift bins (0.05 < z < 0.30, 0.30 < z < 0.60, 0.60 < z < 0.80, and 0.80 < z < 1.00 are shown as the blue, orange, green, and red crosses, respectively). Error bars on the median L150 MHz are calculatedusing the median statistics method from Gott et al. (2001). Also overlaid are the SFR-L150 MHz relationships from Bell (2003, dot-dashed purple line) and Murphy et al. (2011, dashed cyan line), converted to 150 MHz assuming a canonical spectral index α = 0.7, and the 150 MHz relations from G18 (mass-independent shown as the solid orange line, broken power law evaluated at 1010 M⊙ as the dashed purple line) and Wang et al. (2019) (shown as the dotted blue line). The literature calibrations have been converted toour adopted IMF from Chabrier (2003) using the factors recommended in Madau & Dickinson (2014). The horizontal coloured lines immediately to the right of the left-hand vertical axis indicate the luminosity corresponding to the 60 μJy at the lower redshift bound of each bin, as indicated by the colour (see text for details).
Current usage metrics show cumulative count of Article Views (full-text article views including HTML views, PDF and ePub downloads, according to the available data) and Abstracts Views on Vision4Press platform.
Data correspond to usage on the plateform after 2015. The current usage metrics is available 48-96 hours after online publication and is updated daily on week days.
Initial download of the metrics may take a while.