Fig. 6
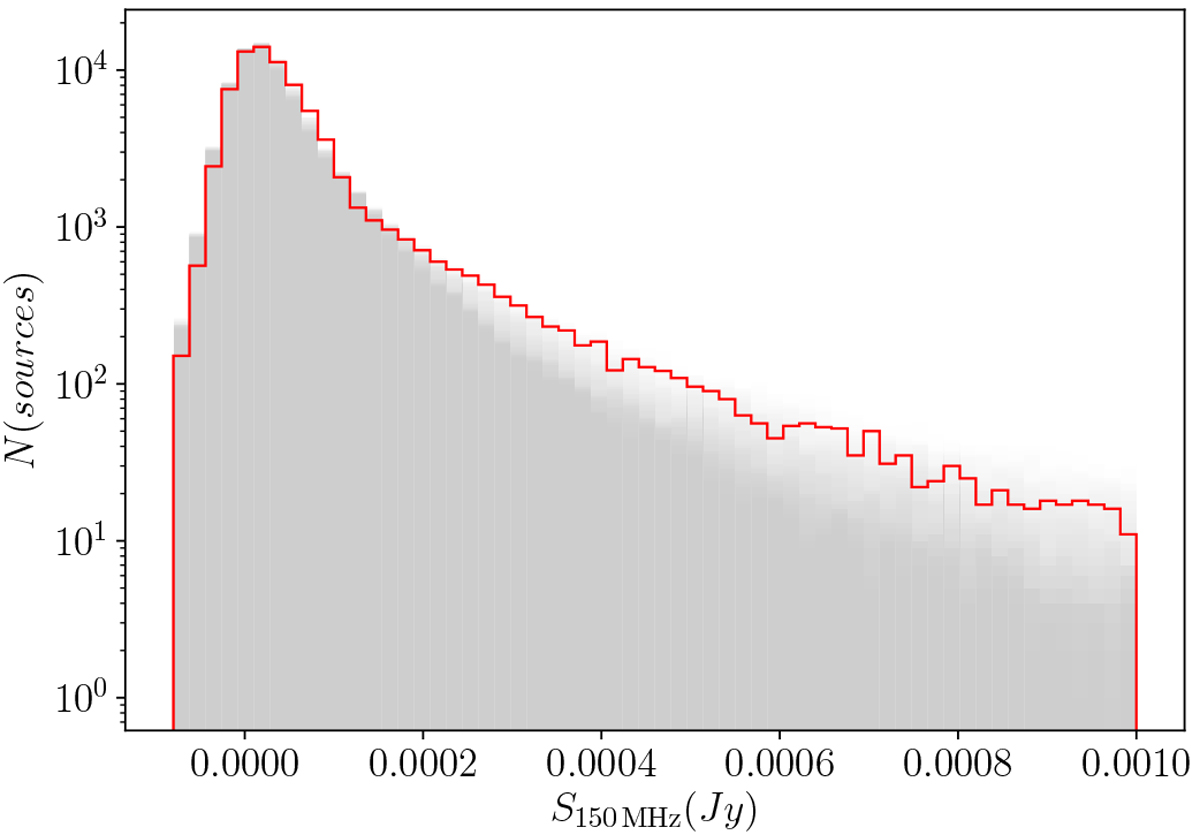
Histogram with logarithmic ordinates, showing the true observed flux density distribution (in red) overlaid on individual Monte Carlo realisations (shown in grey with transparency, such that lighter shading indicates the range of outputs) based on assuming the best-fit SFR-L150 MHz relation from Sect. 3.1 with the full range of intrinsic scatter 0.0 < σL < 0.5.
Current usage metrics show cumulative count of Article Views (full-text article views including HTML views, PDF and ePub downloads, according to the available data) and Abstracts Views on Vision4Press platform.
Data correspond to usage on the plateform after 2015. The current usage metrics is available 48-96 hours after online publication and is updated daily on week days.
Initial download of the metrics may take a while.