Fig. 5
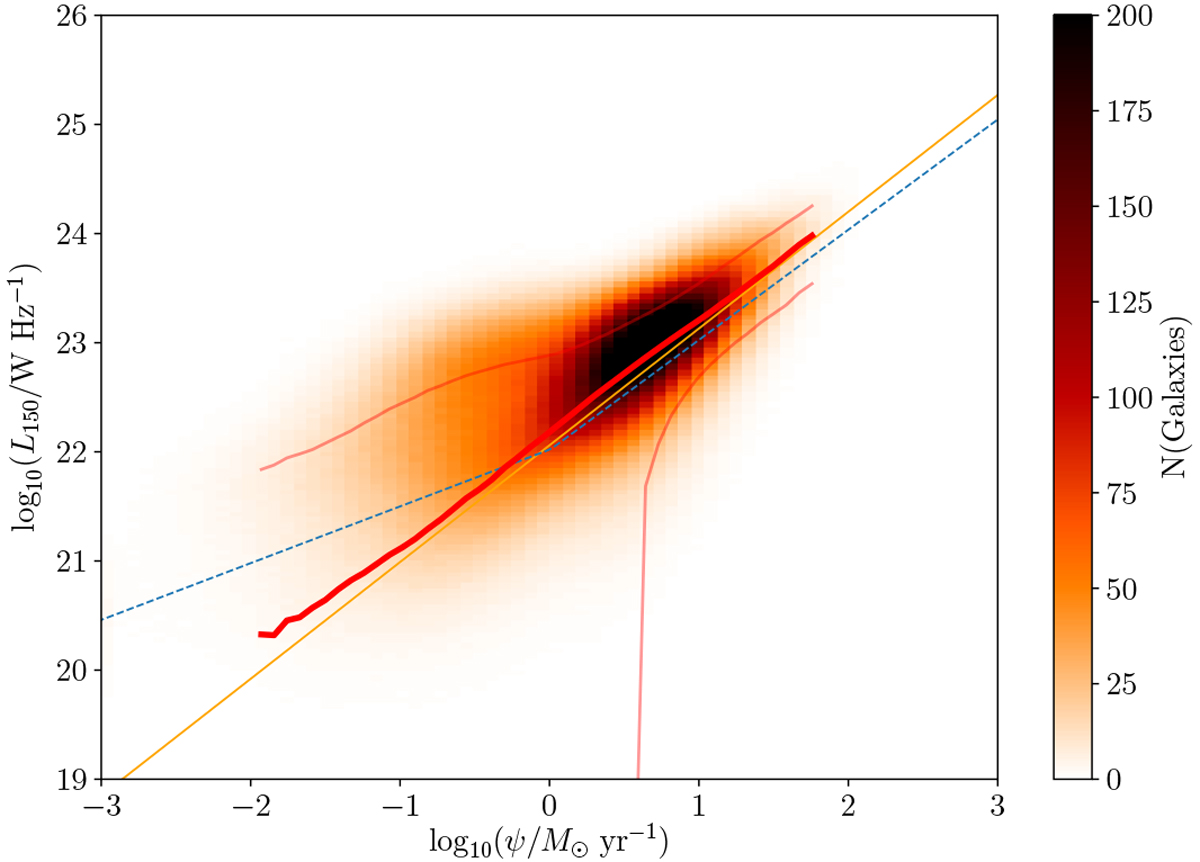
Stacked heatmap showing the two-dimensional PDF for SFR and L150 MHz for all 118 517 galaxies in our sample, including the uncertainties on the SFR (derived based on the percentiles of the MAGPHYS SFR PDF) and on L150 MHz (using the pixel flux densities and rms values at the redshift in the Duncan et al. 2021 catalogue). The “effective” number of galaxies in each bin – we recall that each galaxy is sampled 100 times (with each sample representing 0.01 galaxies) and can therefore contribute to multiple pixels in the stack – is indicated by the colour bar to the right. The best-fit SFR-L150 MHz relationship from G18 is overlaid as the solid orange line, along with the broken power-law G18 relation (which we have evaluated at a canonical stellar mass of 1010 M⊙, and which is shown as the dashed blue line) along with (in red) the 16th, 50th, and 84th percentiles of the L150 MHz distribution at each SFR.
Current usage metrics show cumulative count of Article Views (full-text article views including HTML views, PDF and ePub downloads, according to the available data) and Abstracts Views on Vision4Press platform.
Data correspond to usage on the plateform after 2015. The current usage metrics is available 48-96 hours after online publication and is updated daily on week days.
Initial download of the metrics may take a while.