Fig. 4
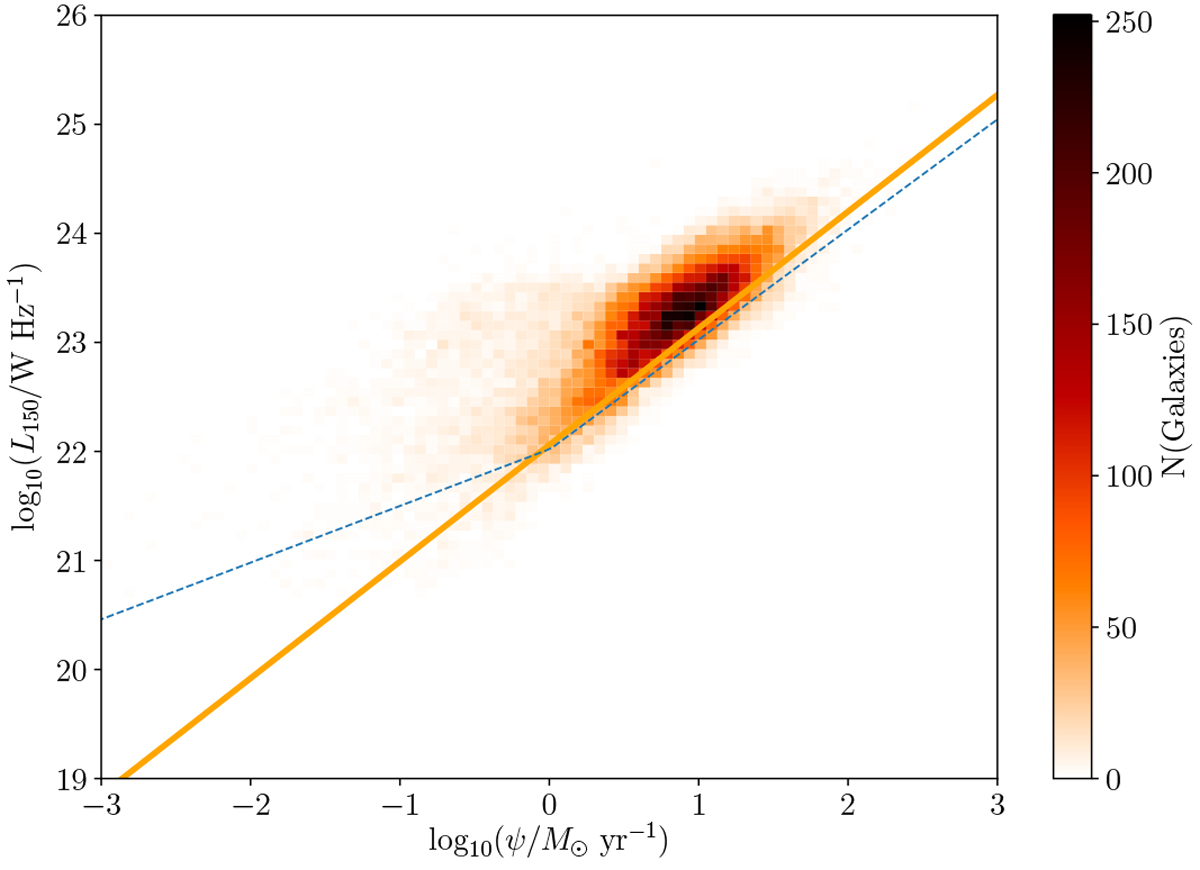
SFR-L150 MHz plane populated by the 25 777 sources with ≥3σ detections in the 150 MHz data, with the colour bar to the right indicating the bin occupancy. The best-fit relations from G18 are overlaid for comparison; the mass-independent relation is shown in orange, while the broken power-law relation evaluated at 1010 M⊙ is shown as the dashed blue line.
Current usage metrics show cumulative count of Article Views (full-text article views including HTML views, PDF and ePub downloads, according to the available data) and Abstracts Views on Vision4Press platform.
Data correspond to usage on the plateform after 2015. The current usage metrics is available 48-96 hours after online publication and is updated daily on week days.
Initial download of the metrics may take a while.