Fig. 3
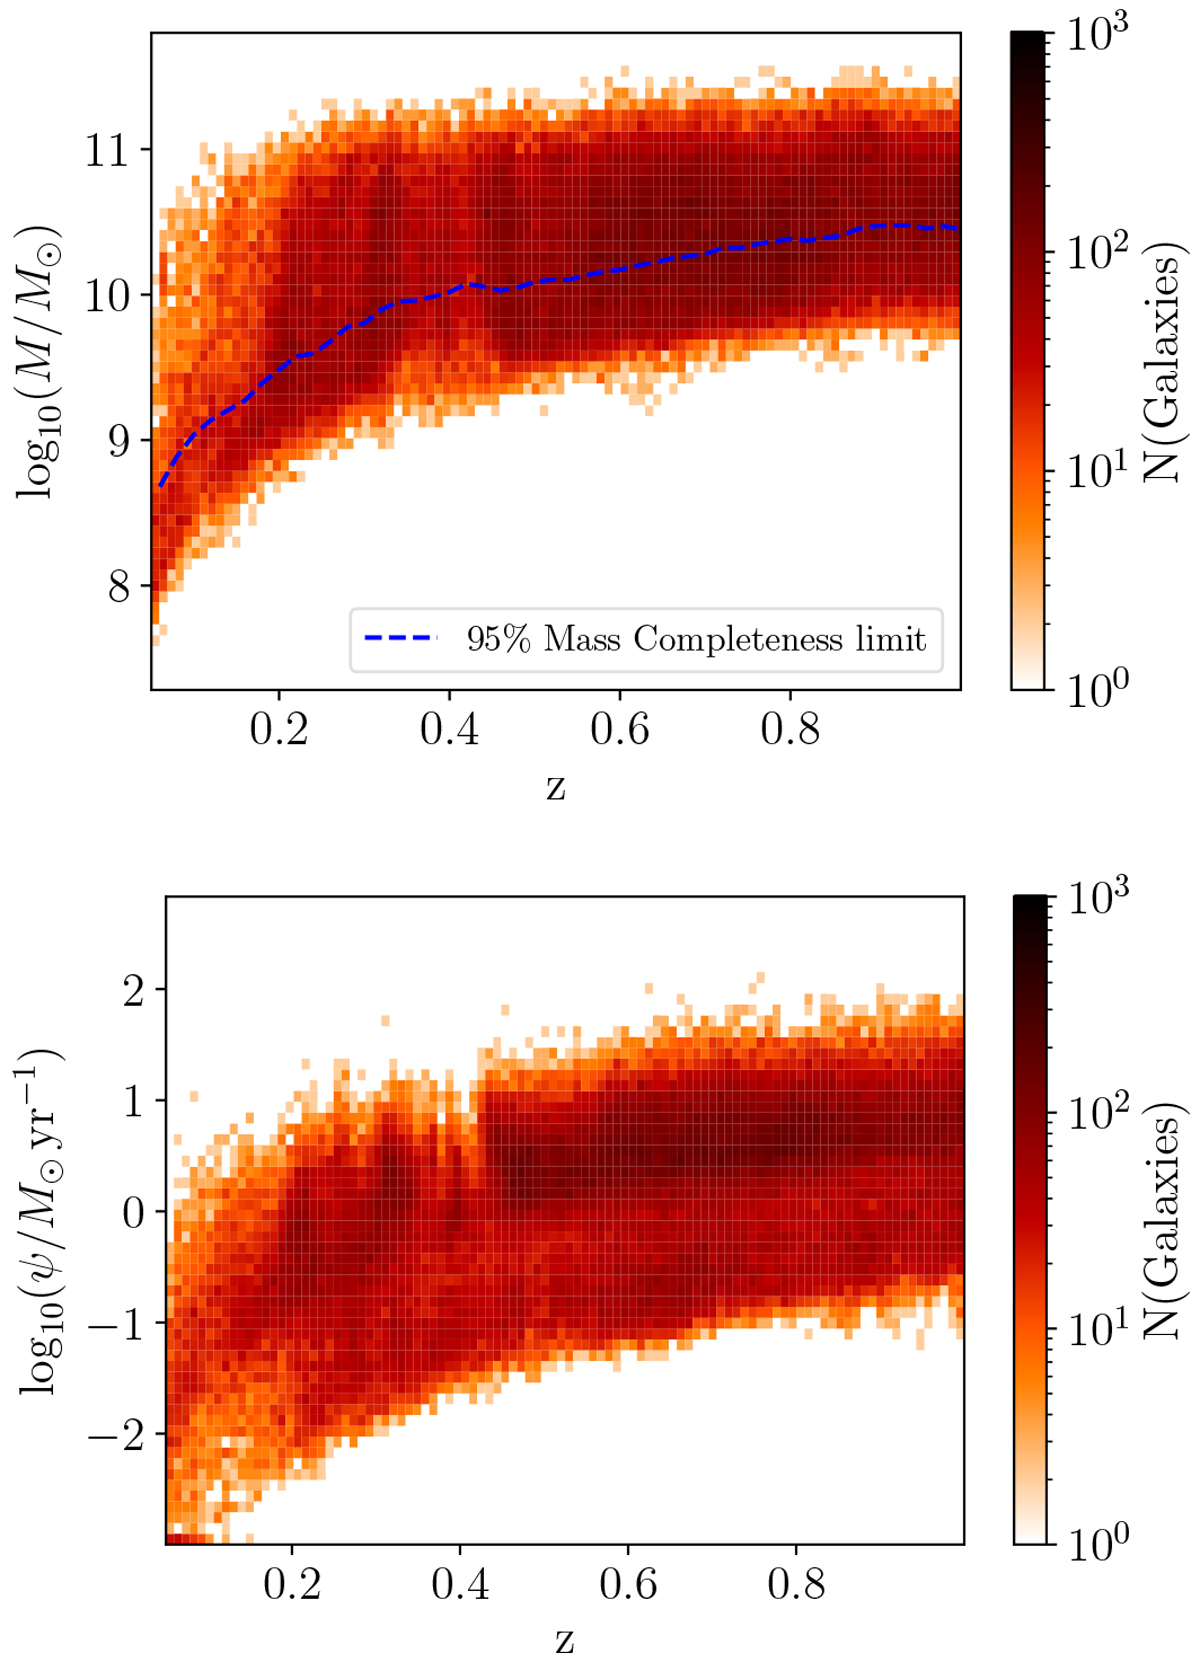
Heatmaps showing the variation in median-likelihood stellar mass in M⊙ (top) and SFR (ψ) in units of M⊙ yr−1 (bottom) as a function of redshift in our IRAC-selected sample. The redshift axis is common to both plots, and the number of galaxies in each bin is indicated by the colour scales to the right. Upper panel: the dashed blue line indicates the 95% mass completeness limit as a function of redshift, derived using the method from Pozzetti et al. (2010).
Current usage metrics show cumulative count of Article Views (full-text article views including HTML views, PDF and ePub downloads, according to the available data) and Abstracts Views on Vision4Press platform.
Data correspond to usage on the plateform after 2015. The current usage metrics is available 48-96 hours after online publication and is updated daily on week days.
Initial download of the metrics may take a while.