Fig. C.4
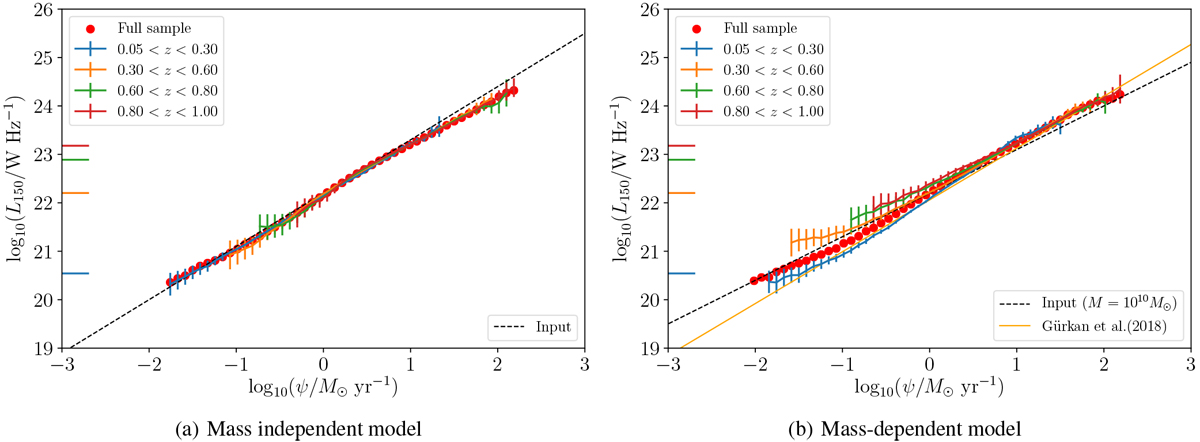
Simulations of possible redshift evolution in the SFR-L150 MHz relation using: (a) a mass-independent input relation of the form given in Eq. (1), and (b) a mass-dependent input relation of the form given in Eq. (2). The method used to obtain these figures is identical, and only the mass-dependent simulation reveals an upturn in L150 MHz at lower SFRs, as seen for the real data set analysed in Fig. 8 (see that caption for further details).
Current usage metrics show cumulative count of Article Views (full-text article views including HTML views, PDF and ePub downloads, according to the available data) and Abstracts Views on Vision4Press platform.
Data correspond to usage on the plateform after 2015. The current usage metrics is available 48-96 hours after online publication and is updated daily on week days.
Initial download of the metrics may take a while.