Fig. C.3
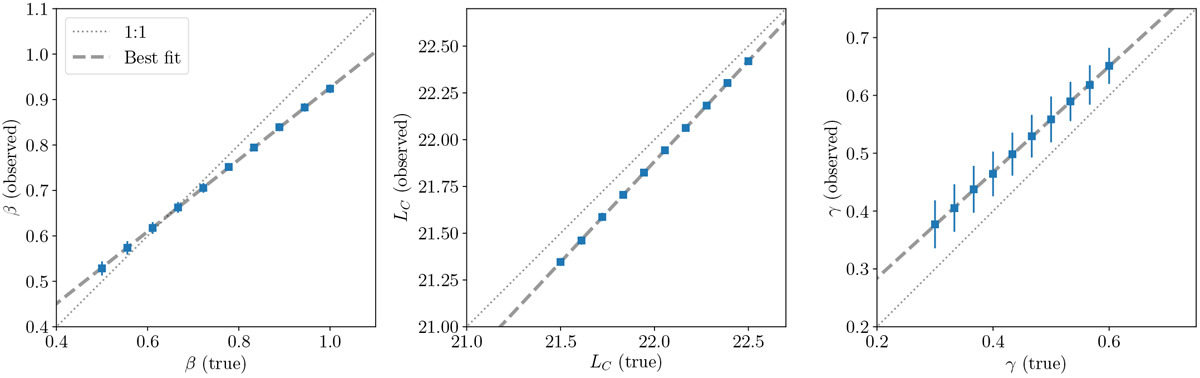
Simulations showing the observed values of β and L1 obtained using the method described in Sect. 3.1 as a function of the known input values, assuming a fixed width of σL = 0.25 and AGN contamination following Sabater et al. (2019). The best-fit relations between the two sets of values are shown as the dashed grey lines, and they are parameterised as in the text. The dotted line in each panel shows the 1:1 relation.
Current usage metrics show cumulative count of Article Views (full-text article views including HTML views, PDF and ePub downloads, according to the available data) and Abstracts Views on Vision4Press platform.
Data correspond to usage on the plateform after 2015. The current usage metrics is available 48-96 hours after online publication and is updated daily on week days.
Initial download of the metrics may take a while.