Fig. C.1
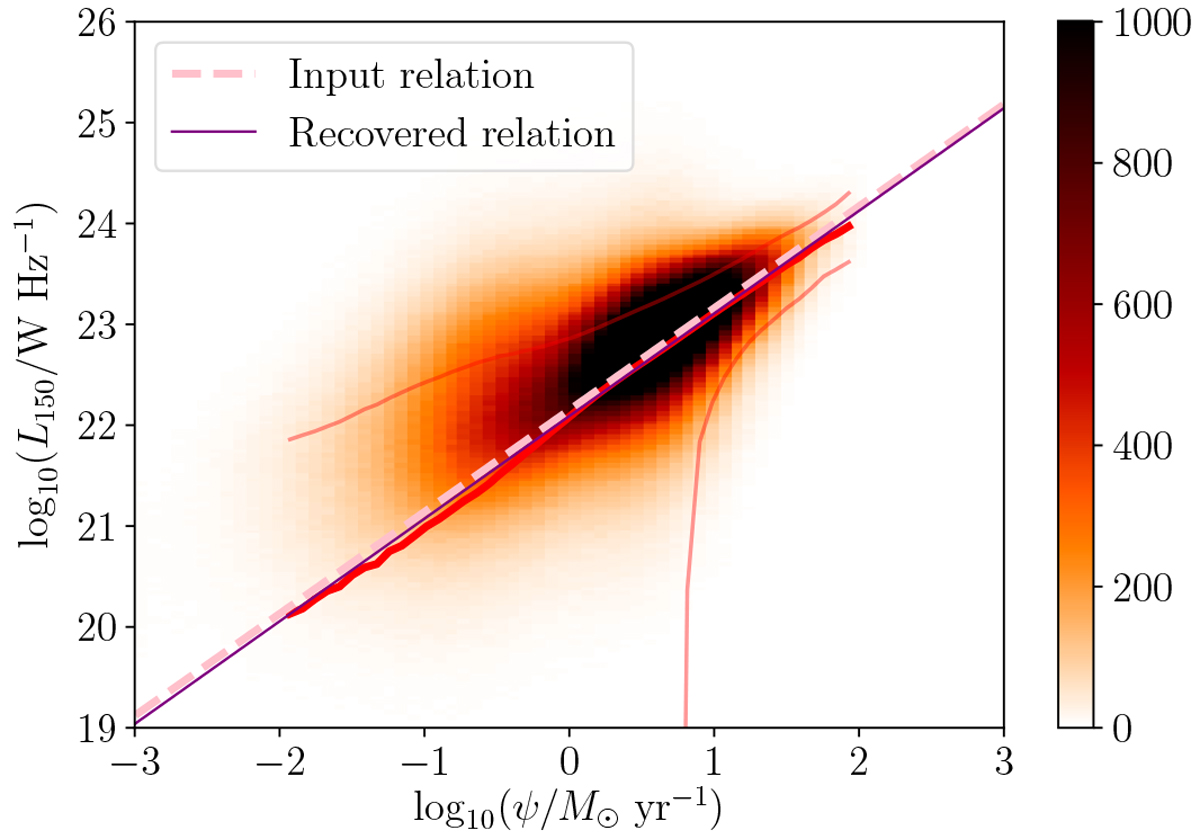
Heatmap showing the stacked two-dimensional PDF derived based on 120 000 galaxies with a redshift distribution sampled from our real data set and accounting for the uncertainties in both SFR and L150 MHz as in Fig. 5. The median-likelihood estimate of the SFR-L150 MHz relation is shown as the thick red line, while the recovered relation (in purple) is very close to the true SFR-L150 MHz relation (dashed pink line). The colour bar to the right shows the effective number of galaxies in each bin.
Current usage metrics show cumulative count of Article Views (full-text article views including HTML views, PDF and ePub downloads, according to the available data) and Abstracts Views on Vision4Press platform.
Data correspond to usage on the plateform after 2015. The current usage metrics is available 48-96 hours after online publication and is updated daily on week days.
Initial download of the metrics may take a while.