Fig. B.1
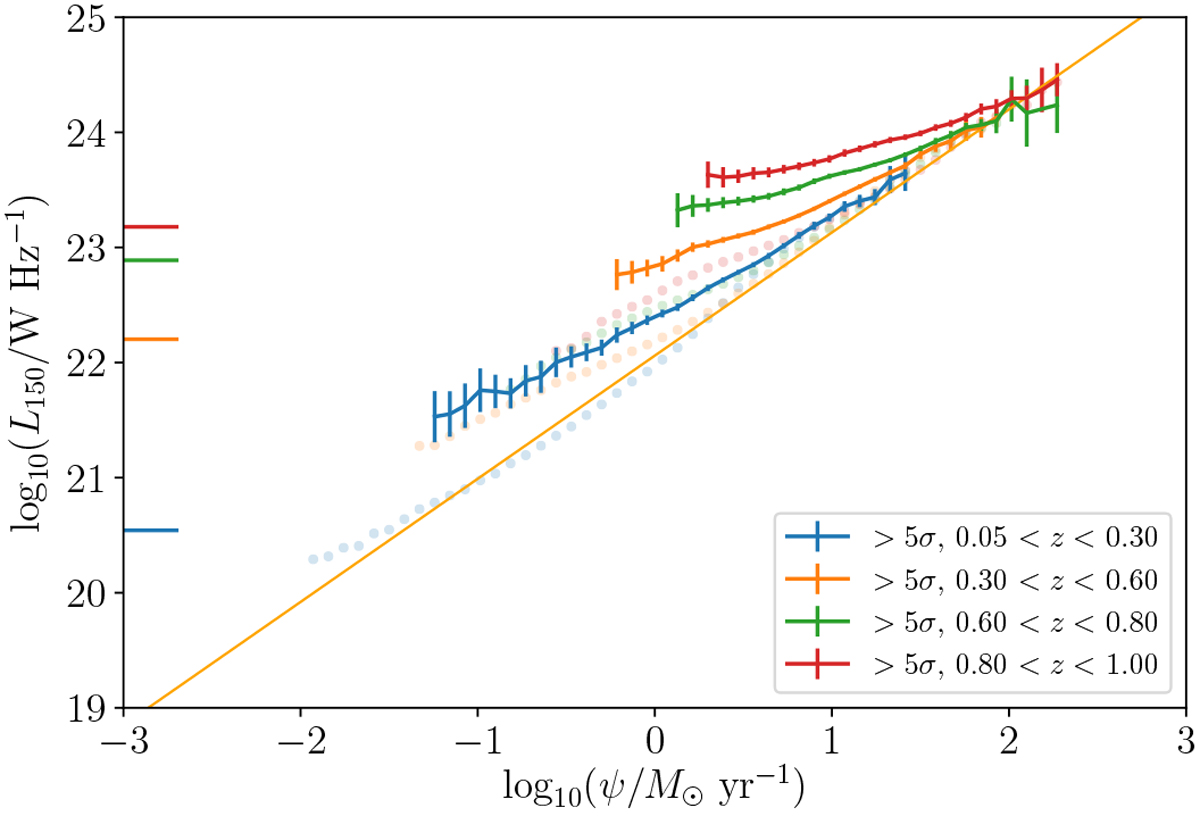
SFR-L150 MHz plane, as inFig. 5. The coloured lines with error bars indicate the SFR-L150 MHz relation recovered in each of the four redshift bins detailed in the legend – identical to those used in Fig. 8, and which are also reproduced here as the circles – but including only those sources with ≥ 5σ 150 MHzdetections. Also overlaid is the best-fit relation from G18; the horizontal bars adjacent to the left-hand vertical axis indicate the luminosity corresponding to 60 μJy at the lower bound of each redshift bin.
Current usage metrics show cumulative count of Article Views (full-text article views including HTML views, PDF and ePub downloads, according to the available data) and Abstracts Views on Vision4Press platform.
Data correspond to usage on the plateform after 2015. The current usage metrics is available 48-96 hours after online publication and is updated daily on week days.
Initial download of the metrics may take a while.