Fig. A.1
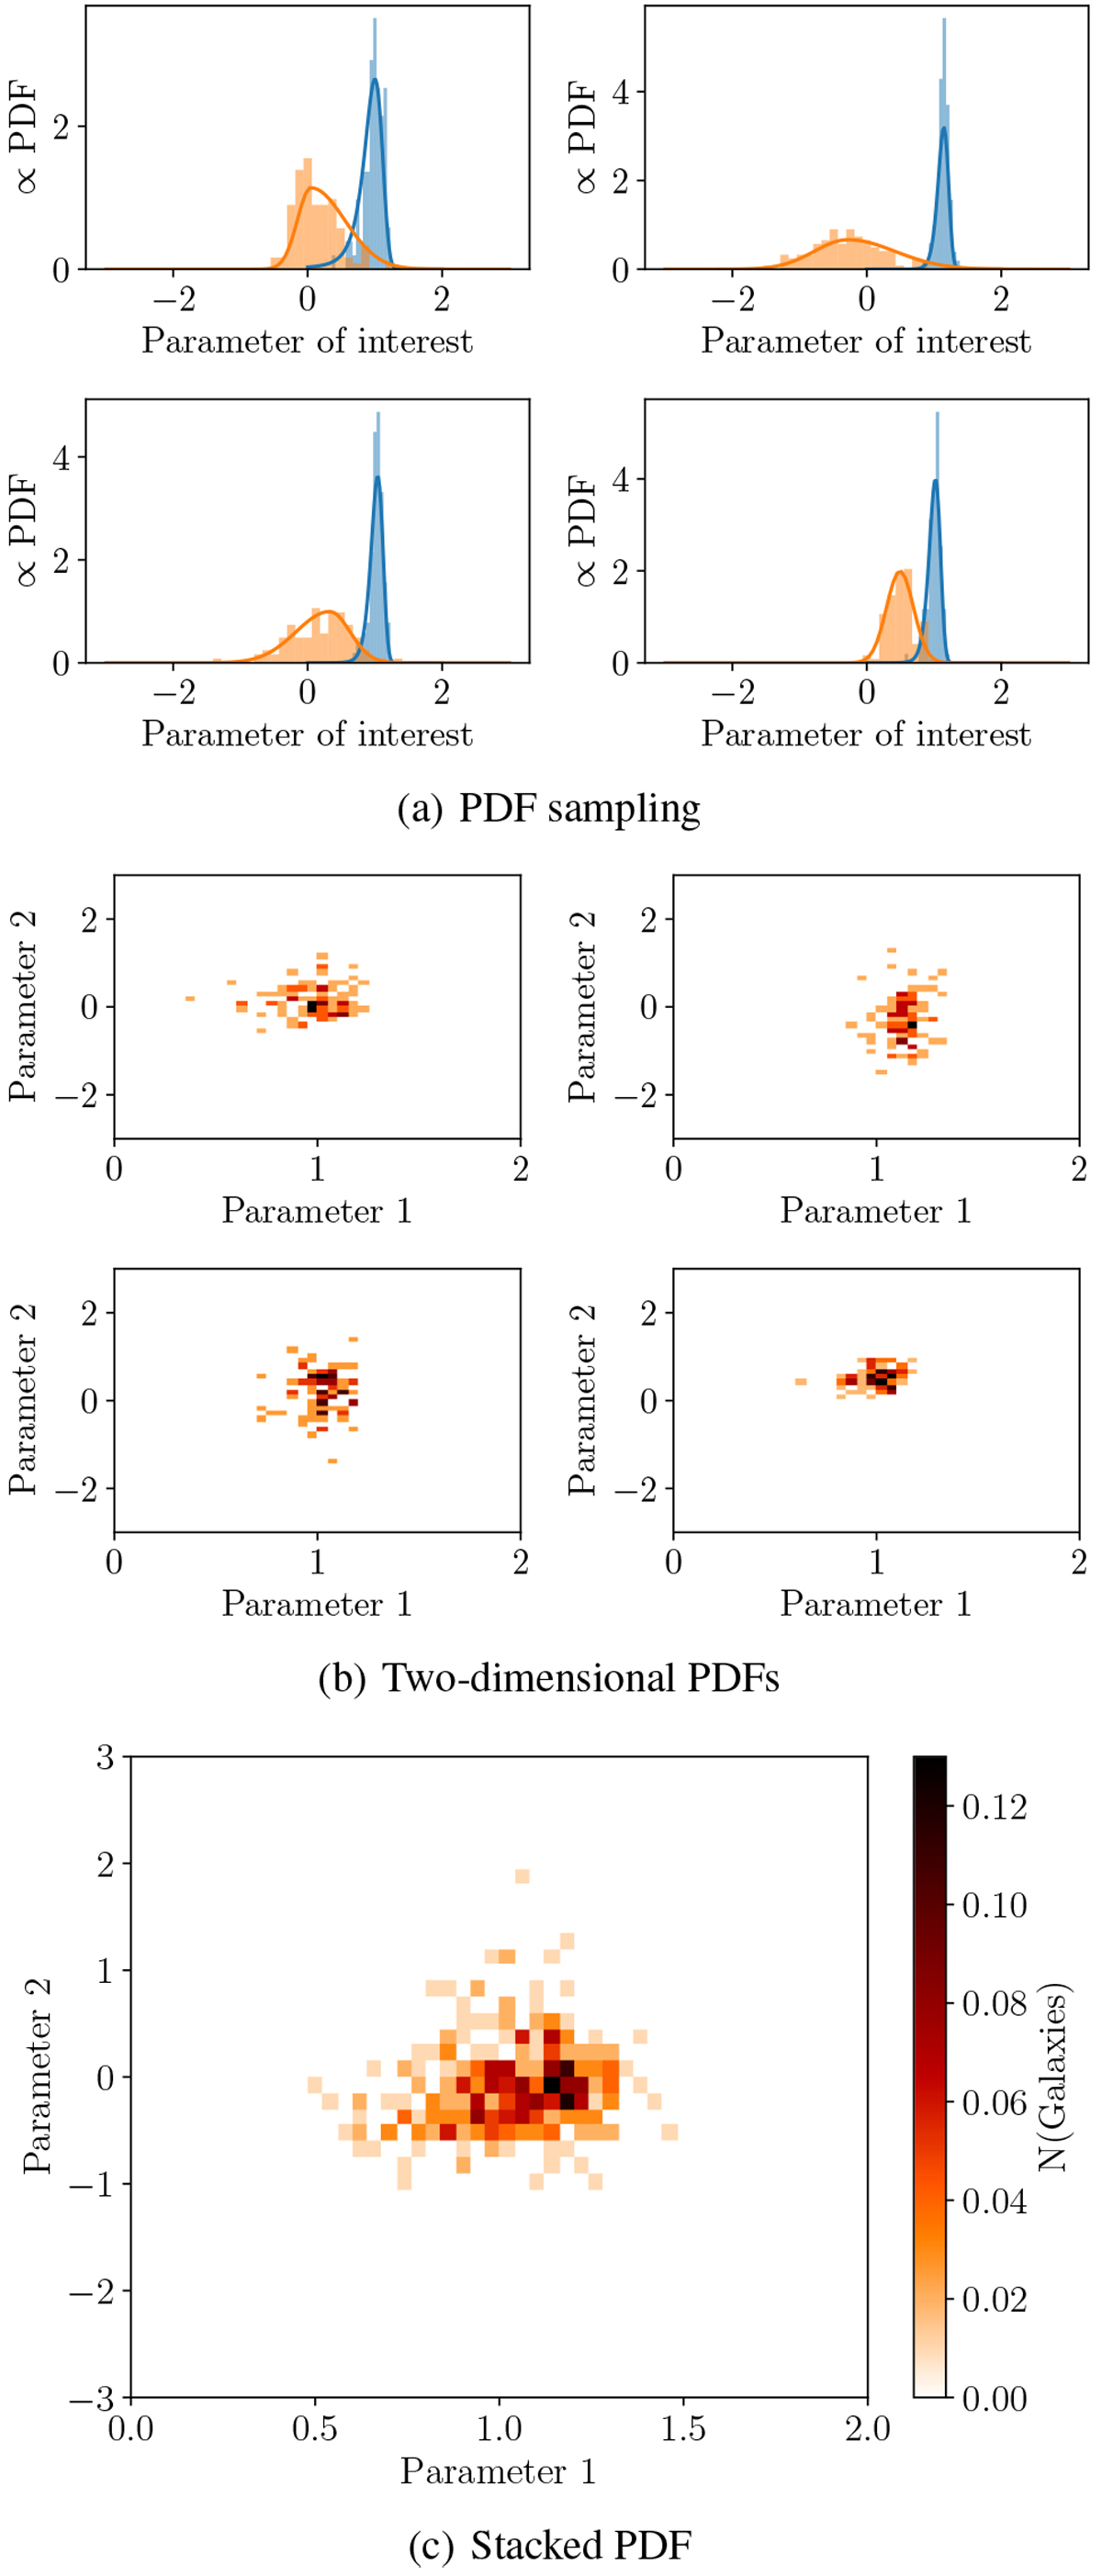
Constructing PDFs for individual galaxies. Top four panels: analytic PDFs assumed for parameter 1 (blue) and parameter 2 (orange). We then created 100 random samples drawn from each distribution, and the results for each parameter are shown as the shaded histograms of the corresponding colours. Middle panels: two-dimensional PDFs for each hypothetical“galaxy”, derived by assuming that the samples shown in the top panels for each parameter are independent. Bottom panel: stack of the individual two-dimensional PDFs for the four model galaxies and the two indicative parameters shown in the upper panels. The colour bar indicates the number of model galaxies that we expect in each bin; the total obtained by summing all of the pixel values equals the total number of galaxies in the stack. Clearly, individual pixels can take non-integer values since we have sampled each galaxy 100 times.
Current usage metrics show cumulative count of Article Views (full-text article views including HTML views, PDF and ePub downloads, according to the available data) and Abstracts Views on Vision4Press platform.
Data correspond to usage on the plateform after 2015. The current usage metrics is available 48-96 hours after online publication and is updated daily on week days.
Initial download of the metrics may take a while.