Fig. 11
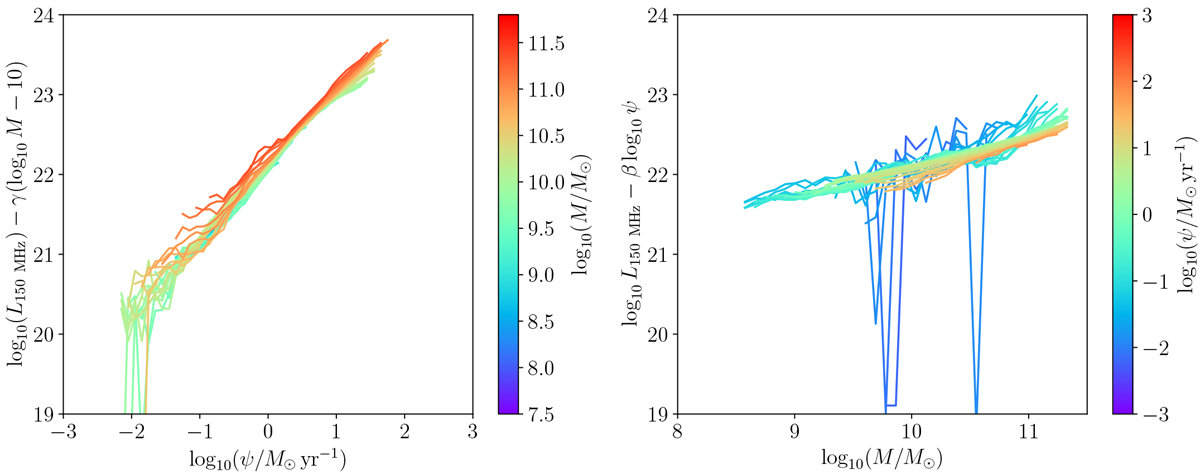
Accounting for stellar mass effects in SFR-L150 MHz. Left: SFR-L150 MHz relationship with the mass dependence taken out using Eq. (2) and the best-fit parameters. Stellar mass is indicated by the colour bar to the right. Right: same as the left, but with the relationship between the stellar mass and radio luminosity normalised by the SFR using Eq. (2).
Current usage metrics show cumulative count of Article Views (full-text article views including HTML views, PDF and ePub downloads, according to the available data) and Abstracts Views on Vision4Press platform.
Data correspond to usage on the plateform after 2015. The current usage metrics is available 48-96 hours after online publication and is updated daily on week days.
Initial download of the metrics may take a while.