Fig. 1
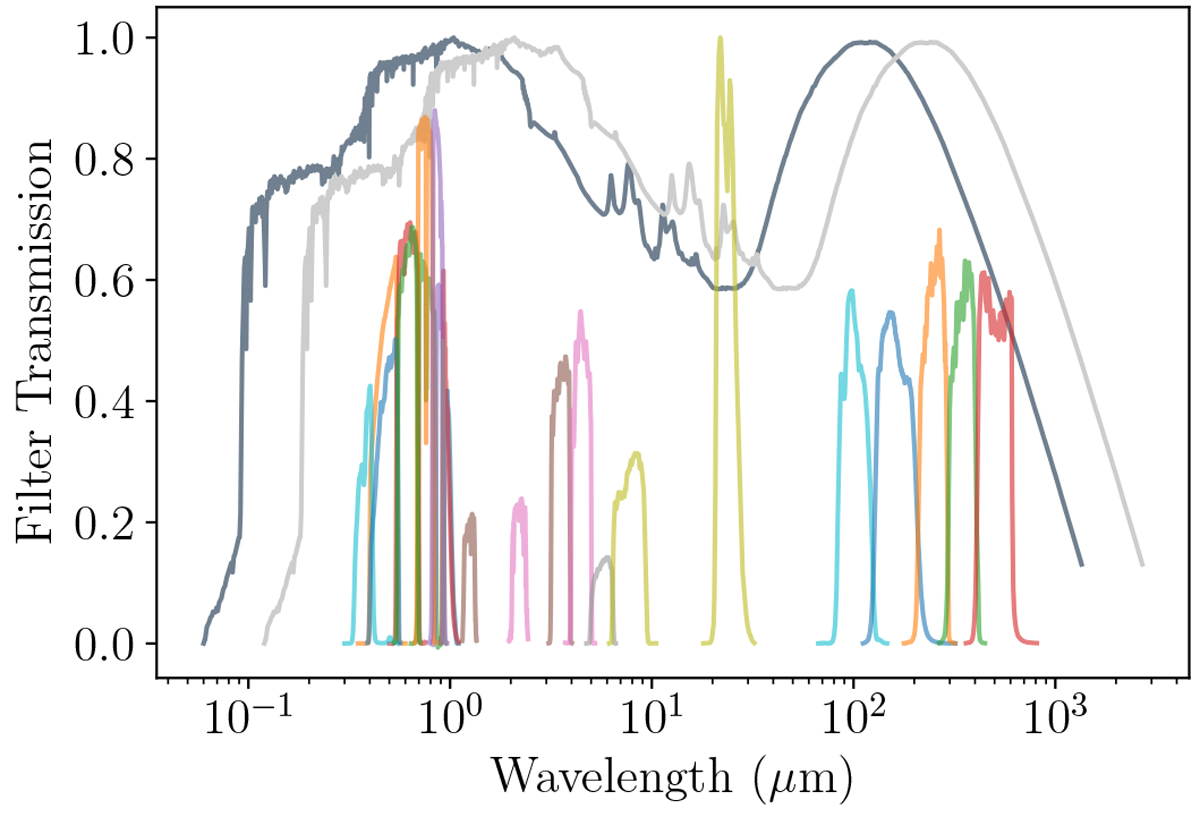
Filter curves of the assembled multi-wavelength data set (coloured lines), overlaid with a galaxy template from Smith et al. (2012). The SED has been normalised to have a peak flux of 1, and it is shown both at z = 0 (in grey) andwith the wavelength axis shifted to z = 1 (in silver) to give the reader an impression of how the excellent multi-wavelength coverage in ELAIS-N1 samples a galaxy’s SED.
Current usage metrics show cumulative count of Article Views (full-text article views including HTML views, PDF and ePub downloads, according to the available data) and Abstracts Views on Vision4Press platform.
Data correspond to usage on the plateform after 2015. The current usage metrics is available 48-96 hours after online publication and is updated daily on week days.
Initial download of the metrics may take a while.