Fig. 8.
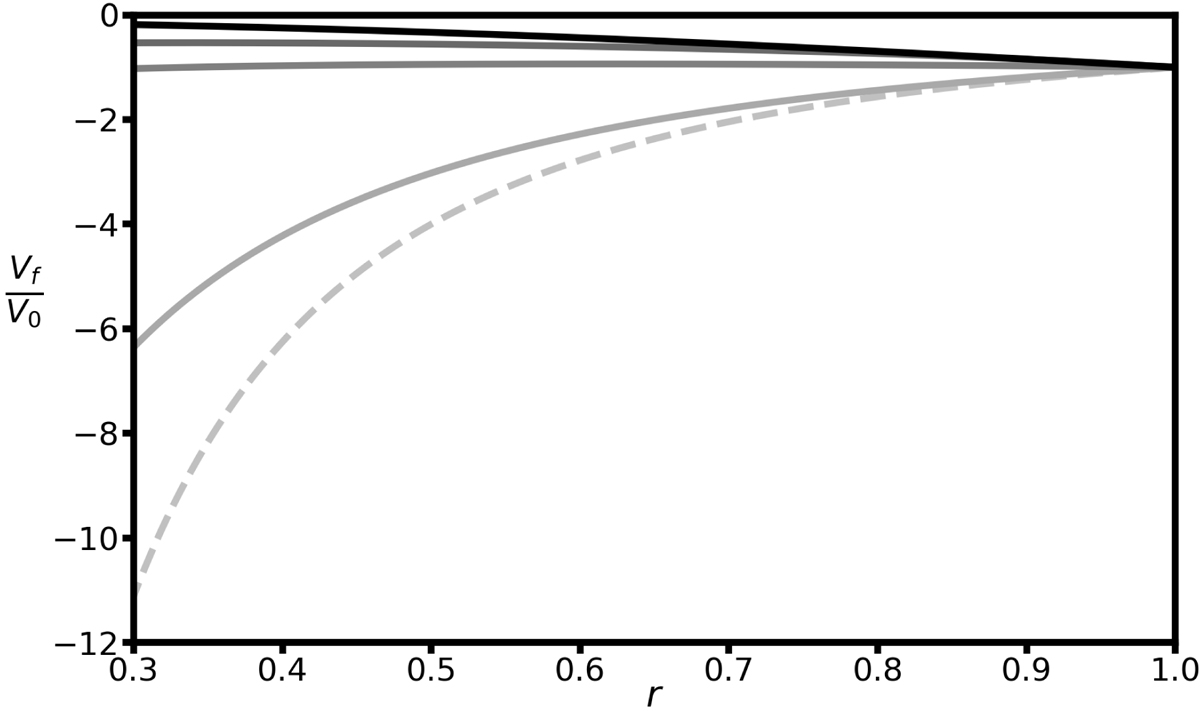
Contraction radial velocity field Vf, Eq. (19), normalised to the top value V0 and plotted as a function of radius r. The lines (from light to dark) show the weakest to the strongest density contrasts between the inner and outer spheres, which are respectively ρi/ρ0 = 1.75, 10.8, 20.9, and 60.2. The contraction radial velocity field in the Boussinesq case given by Eq. (20) (i.e. corresponding to a density ratio of 1) is plotted as a dashed line as a reference.
Current usage metrics show cumulative count of Article Views (full-text article views including HTML views, PDF and ePub downloads, according to the available data) and Abstracts Views on Vision4Press platform.
Data correspond to usage on the plateform after 2015. The current usage metrics is available 48-96 hours after online publication and is updated daily on week days.
Initial download of the metrics may take a while.