Fig. 6.
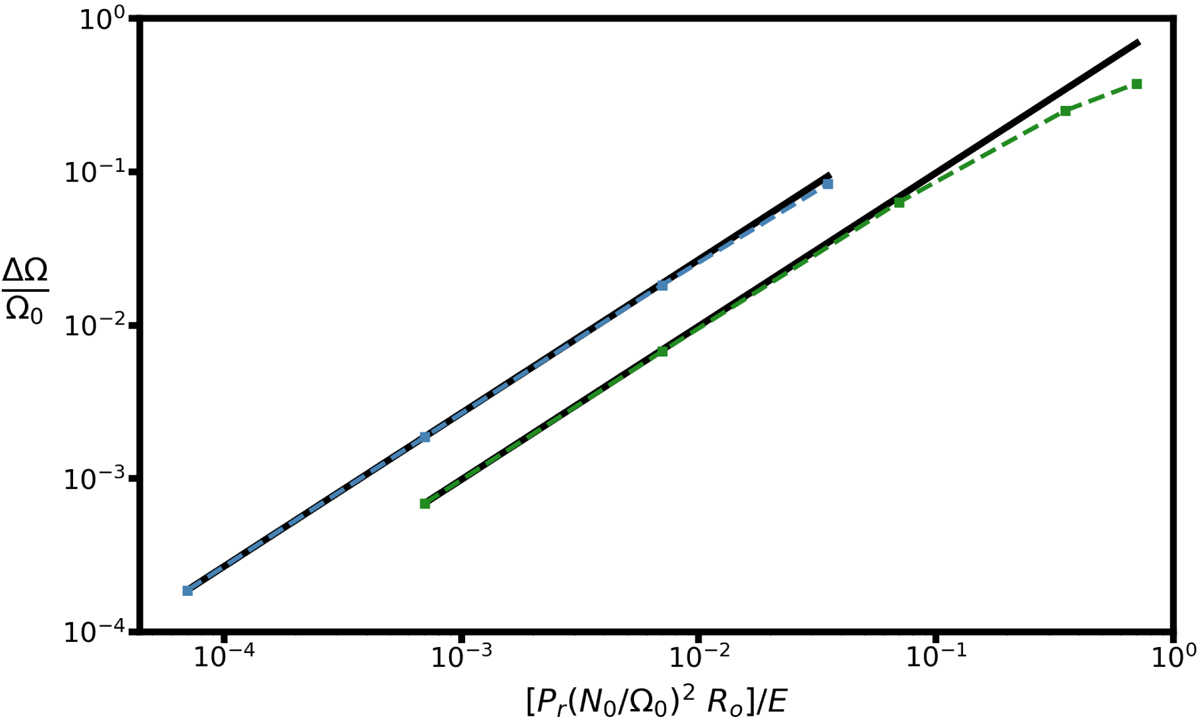
Differential rotation between the inner equator and the outer sphere normalised to the outer value of the rotation rate Ω0 in the Eddington–Sweet regime, plotted as a function of Pr(N0/Ω0)2Ro/E. The Rossby number Ro is varied to encompass the linear and non-linear regimes. The Ekman number is fixed to E = 10−6. The green curve corresponds to simulations with Pr(N0/Ω0)2 = 10−1 (runs 1.4, 3.1, 4.1, 5.1, and 6.1 in Table 4) and the blue curve to simulations with Pr(N0/Ω0)2 = 10−2 (runs 2.2, 3.2, 4.2, and 5.2 in the same table).
Current usage metrics show cumulative count of Article Views (full-text article views including HTML views, PDF and ePub downloads, according to the available data) and Abstracts Views on Vision4Press platform.
Data correspond to usage on the plateform after 2015. The current usage metrics is available 48-96 hours after online publication and is updated daily on week days.
Initial download of the metrics may take a while.