Fig. 15.
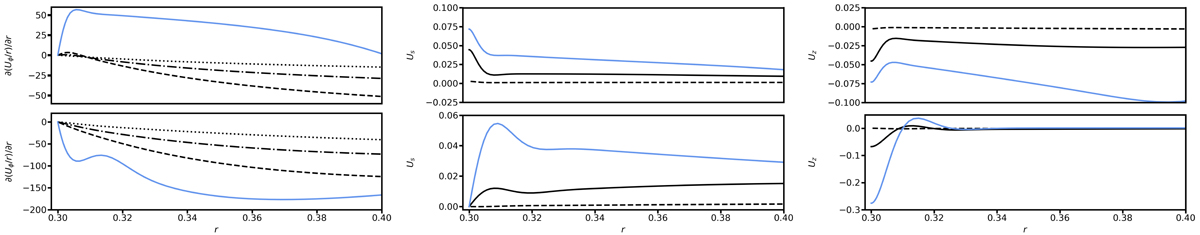
Same as Fig. 10, but for the Eddington–Sweet regime with parameters E = 10−5, Pr(N0/Ω0)2 = 10−1, and Rec = 10−2. The plain blue curve corresponds to the Boussinesq case (run 1.3 in Table 4), while the other curves are obtained by varying the density contrast between the inner and outer spheres in the same way as previously, but for runs 1.2–1.4 in Table 8 in the left panel, and for cases 1.1 and 1.3 in Table 8 in the middle and right panels.
Current usage metrics show cumulative count of Article Views (full-text article views including HTML views, PDF and ePub downloads, according to the available data) and Abstracts Views on Vision4Press platform.
Data correspond to usage on the plateform after 2015. The current usage metrics is available 48-96 hours after online publication and is updated daily on week days.
Initial download of the metrics may take a while.