Fig. 12.
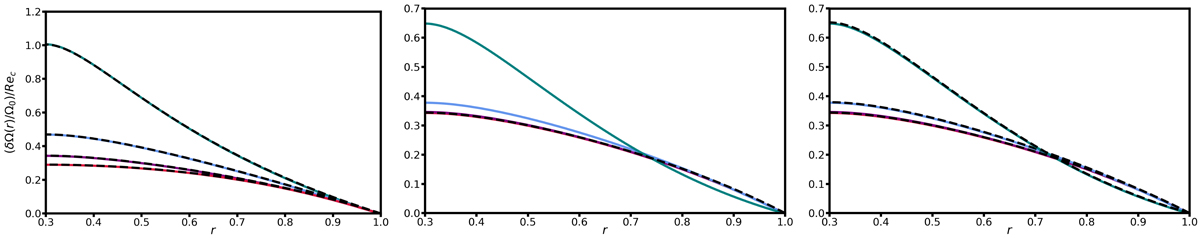
Differential rotation normalised to the rotation rate of the outer sphere δΩ/Ω0, rescaled with Rec and plotted at the latitude θ = π/8 as a function of radius. In each case E = 10−4 and Pr(N0/Ω0)2 = 10 4. Left panel: analytical solution Eq. (56) is represented by dashed lines and numerical solutions (runs 1.1–1.4 in Table 7) as solid coloured lines for the linear regime Rec = 10−2. The colours green, blue, purple, and red correspond respectively to the values of the density contrasts between the inner and outer spheres ρi/ρ0 = 1.75, 10.8, 20.9, and 60.2. Middle panel: numerical solutions are now represented for Rec = 10−2, 10−1, 1, and 10 (red, purple, blue, and green, respectively) for ρi/ρ0 = 20.9 (runs 1.3, 2.3, 3.3, and 4.3 in Table 7). Right panel: same, but when Rec ≥ 1 the solution in dashed lines is numerically estimated by taking the full contraction term in Eq. (55) into account.
Current usage metrics show cumulative count of Article Views (full-text article views including HTML views, PDF and ePub downloads, according to the available data) and Abstracts Views on Vision4Press platform.
Data correspond to usage on the plateform after 2015. The current usage metrics is available 48-96 hours after online publication and is updated daily on week days.
Initial download of the metrics may take a while.