Fig. 8
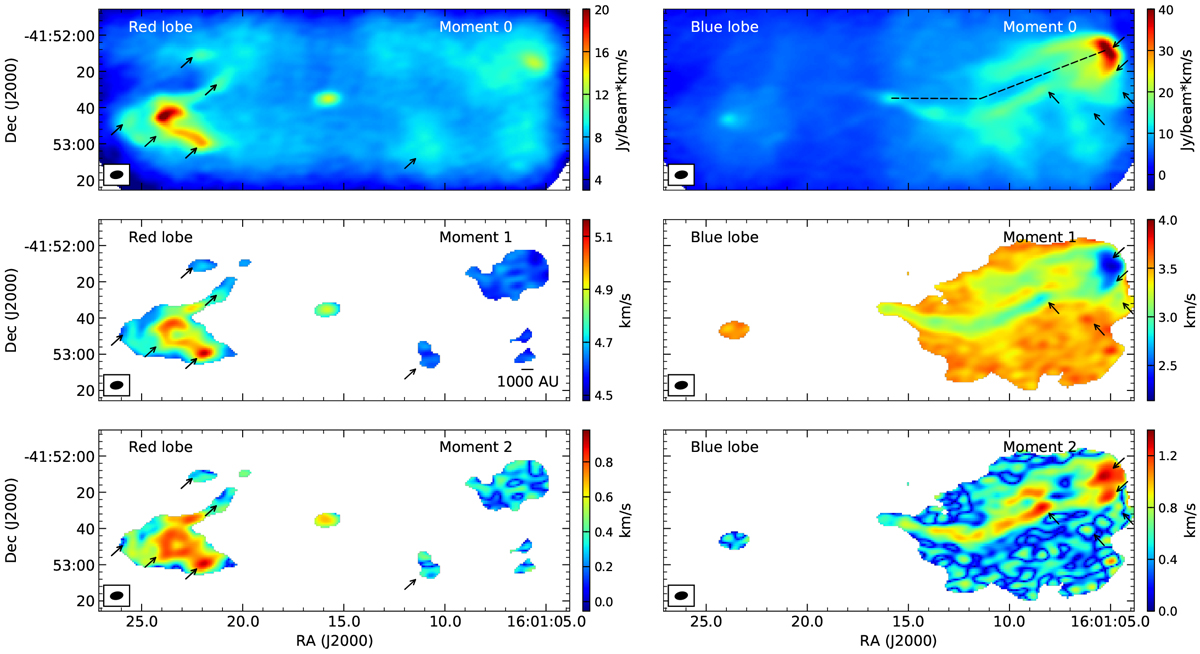
J160115-41523: moment maps of the red (left, from 4.1 to 6.7 km s−1) and blue (right, from –1.5 to 3.6 km s−1) lobes. The systemic velocity is ~4.1 km s−1. Moment 1 and 2 maps only show the emission over 4rms. The black dashed lines in the right upper panel show a 27° deflection in the blue lobe. The arrows point to the features described in the main text, where high velocity or dispersion emission is detected.
Current usage metrics show cumulative count of Article Views (full-text article views including HTML views, PDF and ePub downloads, according to the available data) and Abstracts Views on Vision4Press platform.
Data correspond to usage on the plateform after 2015. The current usage metrics is available 48-96 hours after online publication and is updated daily on week days.
Initial download of the metrics may take a while.