Fig. C.1
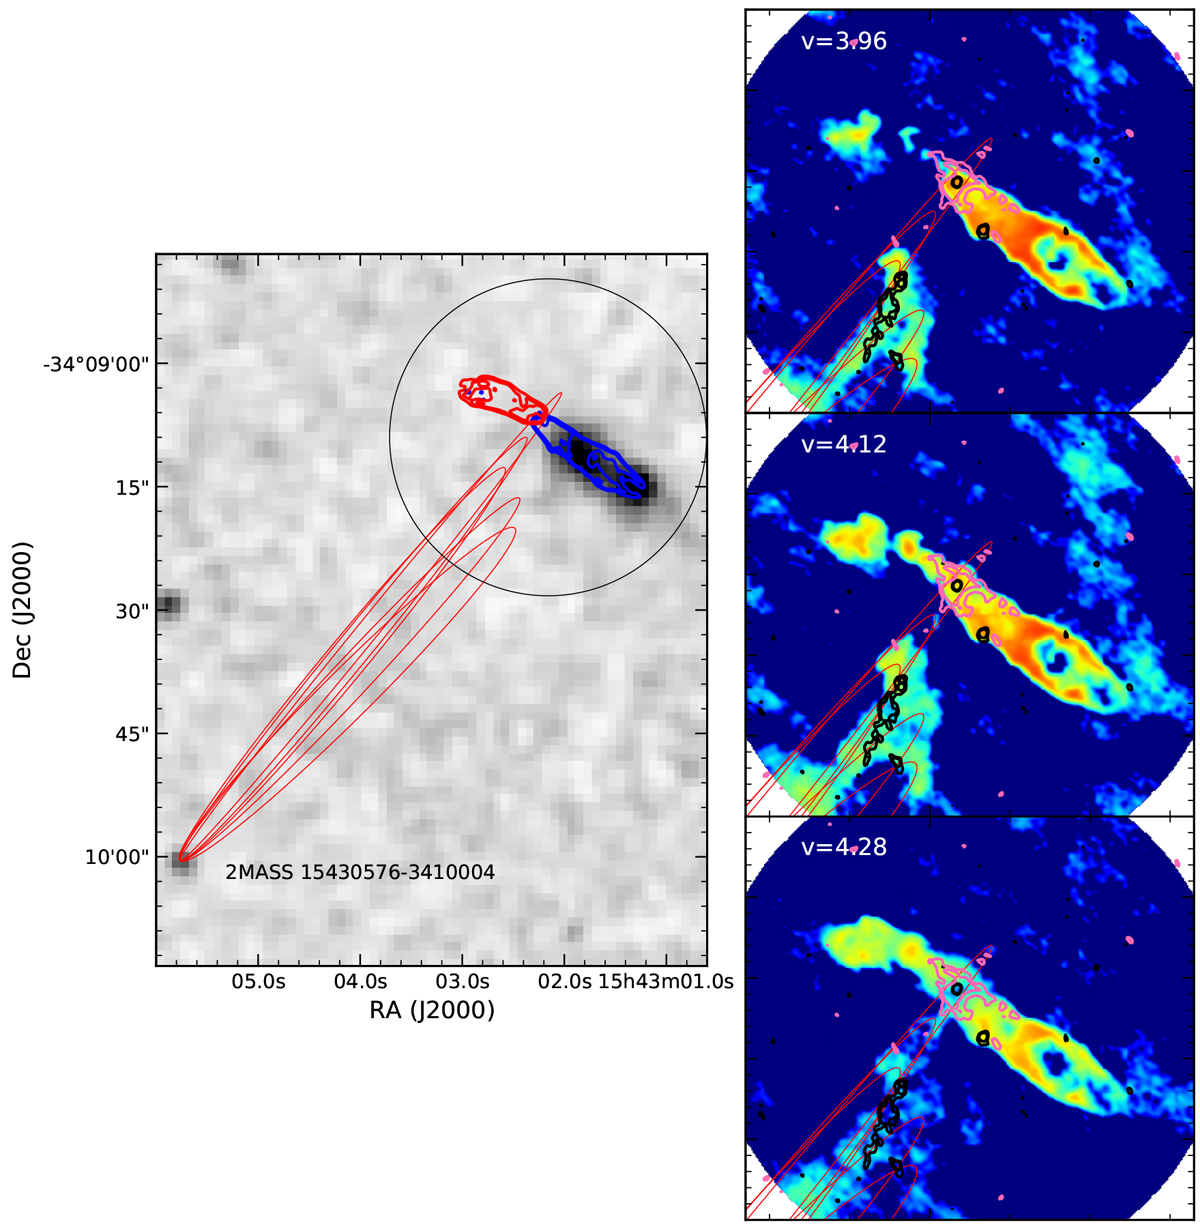
Left: 2MASS Ks band image (gray-scale) and 12CO(2–1) emission associated with the blue and red lobes of IRAS 15398-3359 (blue and red contours, respectively). The source 2MASS 15430576-3410004, located in the left bottom corner in the image, could be driving the 12CO(2–1) emission detected southeast of IRAS 15398-3359. The red ellipses indicate possible ejection interacting with the gas in the vicinity of IRAS 15398-3359. The black circle indicates the region zoomed in the right panels. Right: velocity channel maps of the 12CO(2–1) emission (color scale) near the cloud velocity. SO(65, 54) and C18O(2–1) moment 0 maps are shown in black and pink contours, respectively.
Current usage metrics show cumulative count of Article Views (full-text article views including HTML views, PDF and ePub downloads, according to the available data) and Abstracts Views on Vision4Press platform.
Data correspond to usage on the plateform after 2015. The current usage metrics is available 48-96 hours after online publication and is updated daily on week days.
Initial download of the metrics may take a while.