Fig. 9
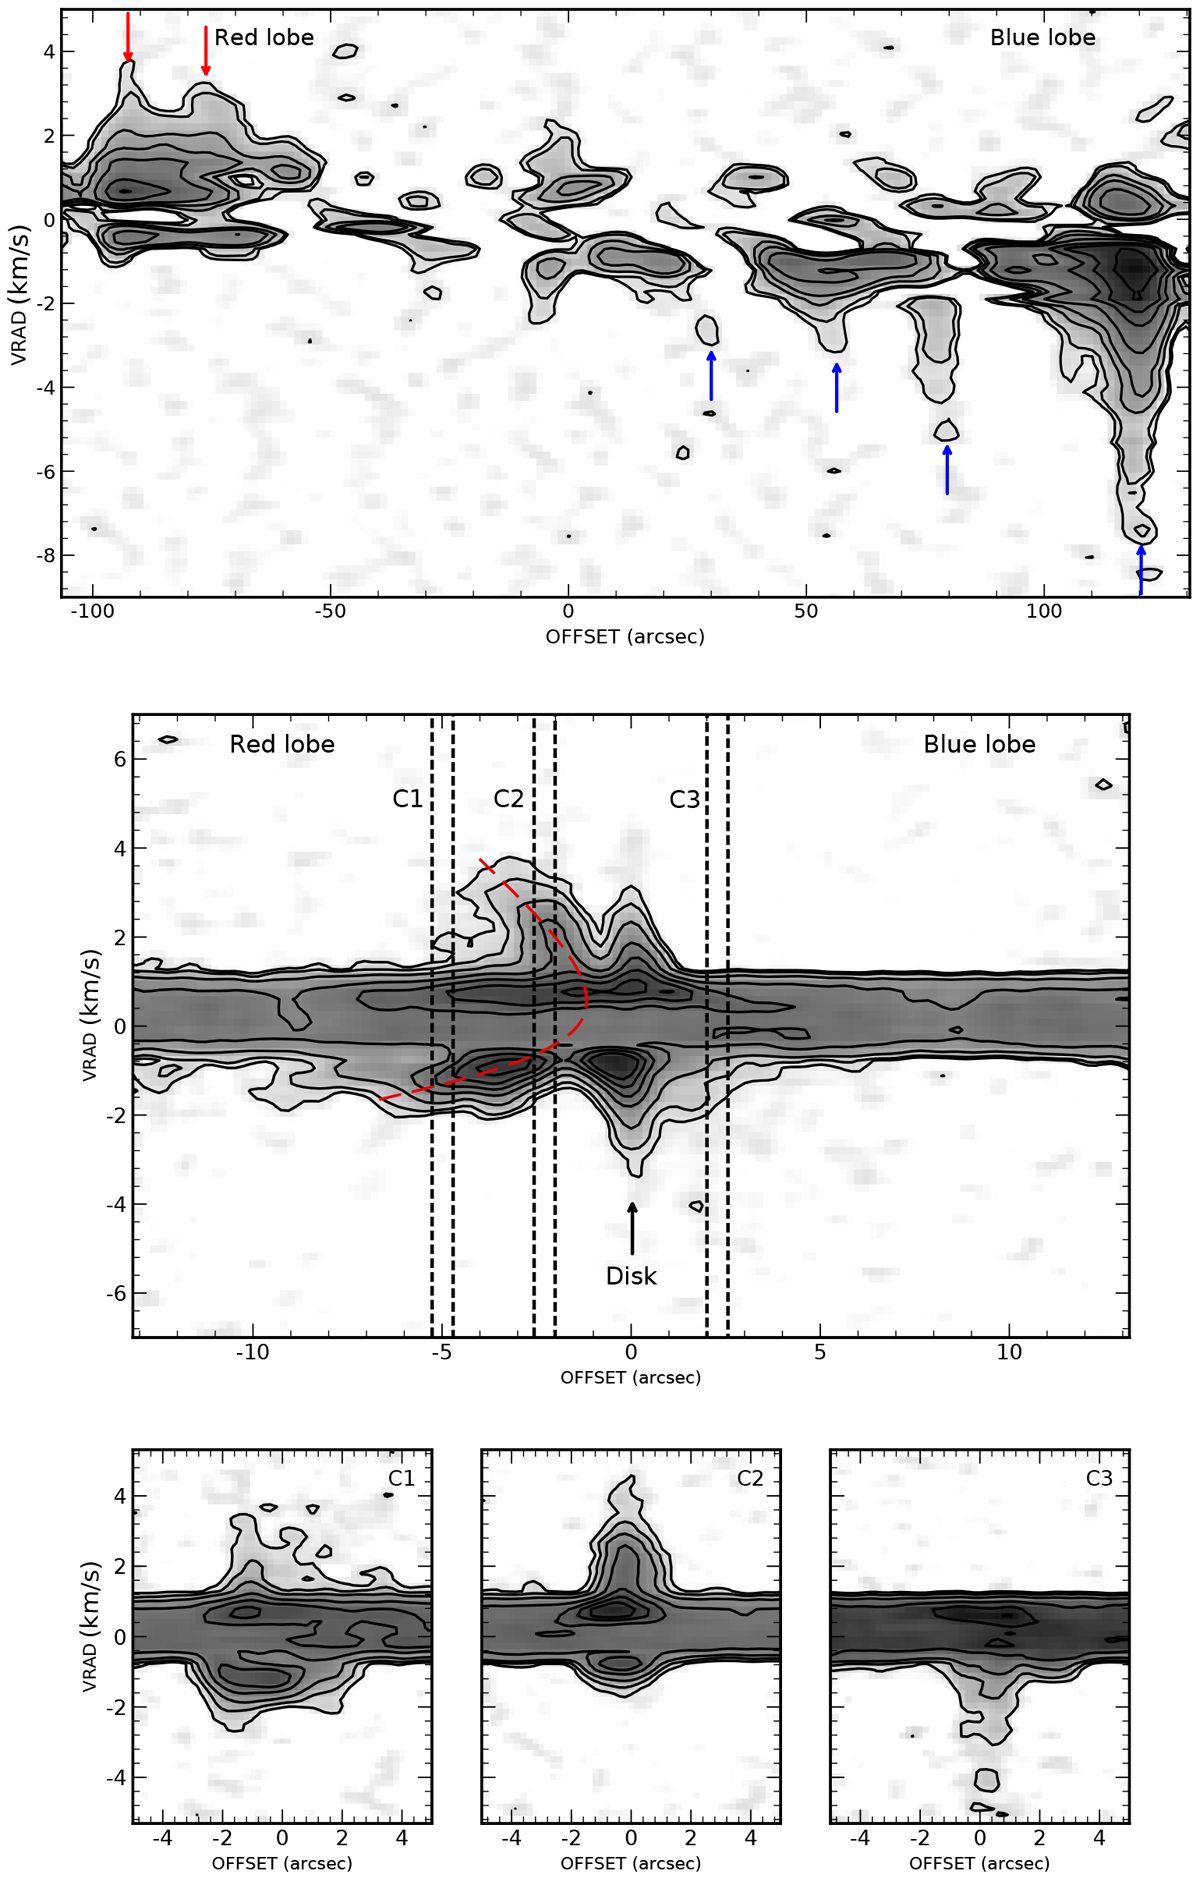
J160115-41523. Upper panel: position-velocity diagram of the 12CO(2–1) emission along the outflow axis with a cut width of 30′′ (low resolution, full outflow). Arrows point out high velocity emission. Middle panel: position-velocity diagram of the 12CO(2–1) emission along the outflow axis with a cut width of 1′′ (high resolution, central region). We indicate the emission from the disk. A parabolic structure, indicated with a red dashed line,crossing the cloud velocity is detected in the red lobe. Bottom panels: position-velocity diagrams of the 12CO(2–1) emission across to the outflow axis at an angular distance of 2′′ and 5′′ from the central source in the red lobe, and 2′′ in the blue lobe.
Current usage metrics show cumulative count of Article Views (full-text article views including HTML views, PDF and ePub downloads, according to the available data) and Abstracts Views on Vision4Press platform.
Data correspond to usage on the plateform after 2015. The current usage metrics is available 48-96 hours after online publication and is updated daily on week days.
Initial download of the metrics may take a while.