Fig. 1
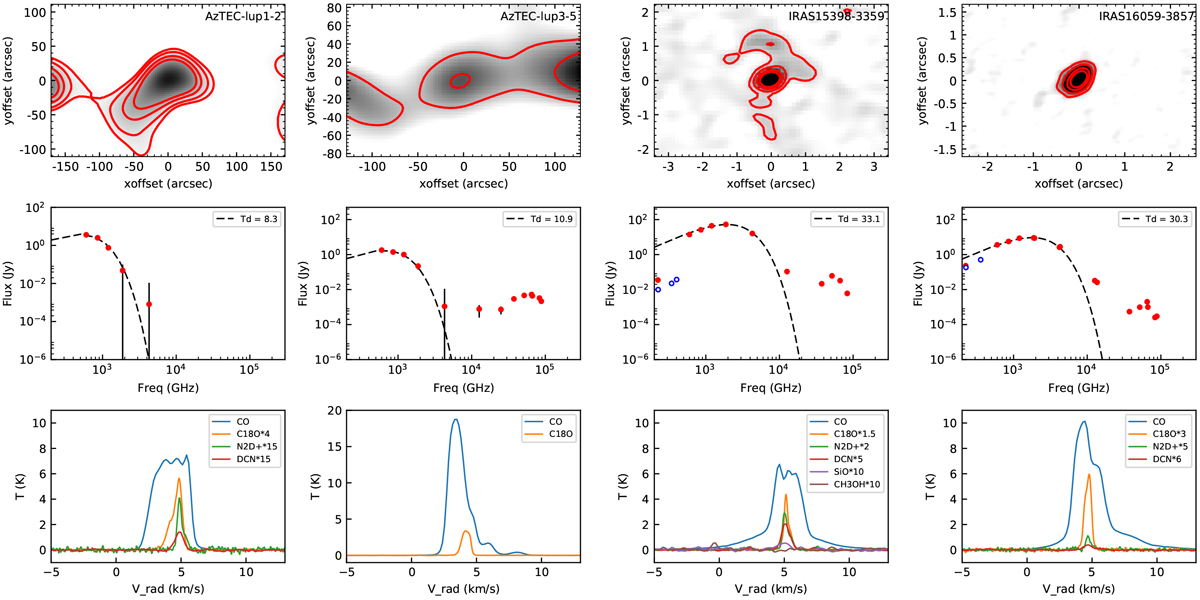
Upper panels: continuum emission toward AzTEC-lup1-2, AzTEC-lup3-5 (ASTE, 1.1 mm), IRAS 15398-3359 and IRAS 16059-3857 (ALMA, 0.8 mm). Contours: 4, 10, 20 and 30 σ. Middle row panels: spectral energy distribution. A black-body could be fitted considering only the FIR and mm emission (black dashed line). The open blue dots corresponding to emission detected in the high resolution mm images are not included in the fit. The dust temperature derived from the fitting is shown in the top right corner. Bottom panels: line emission detected toward the sources at the position of the protostar.
Current usage metrics show cumulative count of Article Views (full-text article views including HTML views, PDF and ePub downloads, according to the available data) and Abstracts Views on Vision4Press platform.
Data correspond to usage on the plateform after 2015. The current usage metrics is available 48-96 hours after online publication and is updated daily on week days.
Initial download of the metrics may take a while.