Fig. 4.
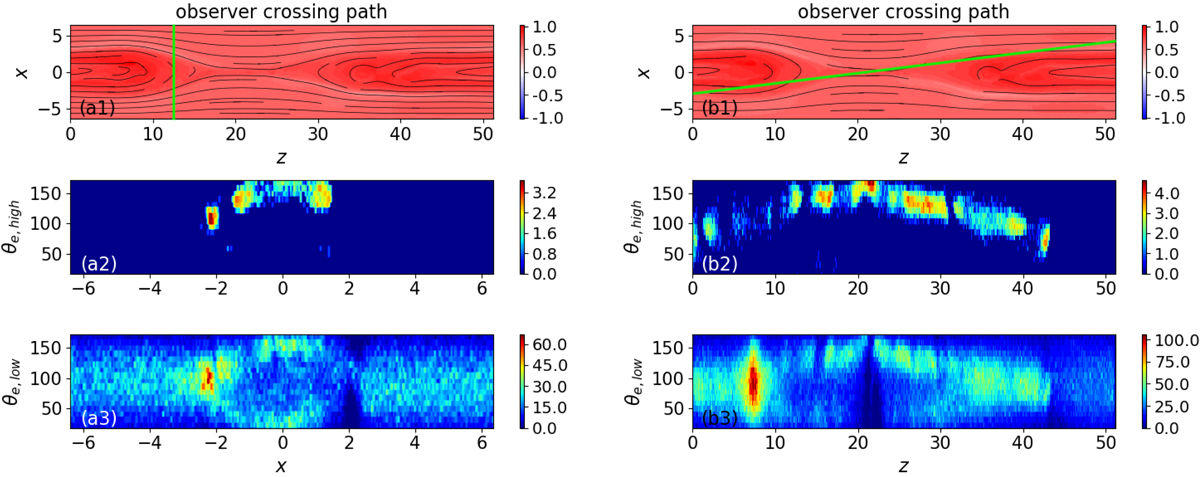
PADs observed by a virtual spacecraft in the simulation starting with a strong guiding field (bg = 1) at t = 33Ωi. Left column: path perpendicular to the midplane x = 0. Right column: path across the separatrices. The magnetic field and the paths of the spacecraft (green lines) are demonstrated in the top row. The middle and bottom rows present the PADs of higher- and lower-energy electrons observed on the paths.
Current usage metrics show cumulative count of Article Views (full-text article views including HTML views, PDF and ePub downloads, according to the available data) and Abstracts Views on Vision4Press platform.
Data correspond to usage on the plateform after 2015. The current usage metrics is available 48-96 hours after online publication and is updated daily on week days.
Initial download of the metrics may take a while.