| Issue |
A&A
Volume 632, December 2019
|
|
|---|---|---|
| Article Number | A129 | |
| Number of page(s) | 10 | |
| Section | The Sun | |
| DOI | https://doi.org/10.1051/0004-6361/201936733 | |
| Published online | 17 December 2019 | |
Comparison of counterstreaming suprathermal electron signatures of ICMEs with and without magnetic cloud: are all ICMEs flux ropes?
Institute of Space Physics, Luoyang Normal University, Luoyang 471934, PR China
e-mail: This email address is being protected from spambots. You need JavaScript enabled to view it.
Received:
19
September
2019
Accepted:
13
November
2019
Abstract
Context. Magnetic clouds (MCs), as in large-scale interplanetary magnetic flux ropes, are usually still connected to the Sun at both ends near 1 AU. Many researchers believe that all nonMC interplanetary coronal mass ejections (ICMEs) also have magnetic flux rope structures, which are inconspicuous because the observing spacecraft crosses the flanks of the rope structures. If so, the field lines of nonMC ICMEs should also usually be connected to the Sun at both ends.
Aims. We want to know whether or not the field lines of most nonMC ICMEs are still connected to the Sun at both ends.
Methods. This study examined the counterstreaming suprathermal electron (CSE) signatures of 272 ICMEs observed by the Advanced Composition Explorer (ACE) spacecraft from 1998 to 2008 and compared the CSE signatures of MCs and nonMC ICMEs.
Results. Results show that only 10 of the 101 MC events (9.9% ) and 75 of the 171 nonMC events (43.9%) have no CSEs. Moreover, 21 of the nonMC ICMEs have high CSE percentages (more than 70%) and show relatively stable magnetic field components with slight rotations, which are in line with the expectations that the observing spacecraft passes through the flank of magnetic flux ropes. Therefore, the 21 events may be magnetic flux ropes but the ACE spacecraft passes through their flanks of magnetic flux ropes.
Conclusions. Considering that most other nonMC events have disordered magnetic fields, we suggest that some nonMC ICMEs inherently have disordered magnetic fields, and therefore no magnetic flux rope structures.
Key words: Sun: coronal mass ejections (CMEs) / solar wind
© J. Wang et al. 2019
 Open Access article, published by EDP Sciences, under the terms of the Creative Commons Attribution License (http://creativecommons.org/licenses/by/4.0), which permits unrestricted use, distribution, and reproduction in any medium, provided the original work is properly cited.
1. Introduction
Coronal mass ejections (CMEs) are intense solar explosive eruptions during which large amounts of plasma and magnetic field from the solar atmosphere are ejected into interplanetary space. The interplanetary manifestations of CMEs (ICMEs; Kilpua et al. 2017) can be measured by a spacecraft at about 1 AU and exhibit the following characteristics: increase in total magnetic magnitude (Cane & Richardson 2003), helium abundance (Hirshberg et al. 1972; Zwickl et al. 1982; Richardson & Cane 2004), average iron ionization (Lepri et al. 2001; Lepri & Zurbuchen 2004), and O7+ abundance (Richardson & Cane 2004; Wang & Feng 2016); decrease in proton temperatures and proton densities (Gosling et al. 2001; Zhang et al. 2013); counterstreaming suprathermal electron (CSE) strahls and declining speed (Zwickl et al. 1982; Gosling et al. 1987; Shodhan et al. 2000; Burlaga et al. 2001). A subset of ICMEs was defined as magnetic cloud (MC) by Burlaga et al. (1981) empirically using the following properties: (1) the magnetic field strength is higher than average, (2) a smooth change in field direction as observed by a spacecraft passing through the cloud, and (3) low proton temperature compared to that of the ambient proton. Magnetic clouds usually have magnetic flux rope structures, and they are the main source of major geomagnetic storms (Burlaga et al. 1981; Webb et al. 2000; Huttunen et al. 2002; Zhang et al. 2007). Observations at 1 AU show that 30 − 40% of ICMEs are MCs, and this percentage depends on the solar cycle (Richardson & Cane 2004). However, CMEs are usually assumed to have magnetic flux rope structures near the Sun because of their helical shapes (Canfield et al. 1999; Liu et al. 2010; Rust & Kumar 1996). This begs the question of whether or not nonMC ICMEs also have flux rope structures. The journal of Solar Physics once made a special issue to address this question (Gopalswamy et al. 2013a). A comparative study of 23 MCs and 31 nonMC ICMEs was completed, and the source regions of the 54 ICMEs were located within ±15° longitude from the disk center. Yashiro et al. (2013) found no significant difference between the structures of the post-eruption arcades of MCs and nonMC ICMEs during launch. Gopalswamy et al. (2013b) observed that MCs and nonMC ICMEs have significant enhancement in Fe and O charge states, and Fe and O charge-state measurements are positively correlated with flare properties, including flare size and soft X-ray flare intensity. Their observations suggest that these CMEs have similar explosive environment and flux rope structures near the Sun. Furthermore, some studies indicate that CMEs associated with MCs tend to propagate along the Sun–Earth line, whereas nonMC events are deflected away from the Sun–Earth line (Kim et al. 2013; Mäkelä et al. 2013; Zhang et al. 2013). Therefore, many researchers believe that all ICMEs have magnetic flux rope structures and that the nonMC events are due to observational limitations, that is, that the observing spacecraft crosses the flanks of the ropes and therefore the ICMEs appear as nonMCs. This has been shown by some multi-satellite-observed ICMEs, namely spacecraft farther from the axis detect less clear flux rope signatures than centrally crossing spacecraft for the same event (Cane et al. 1997; Kilpua et al. 2011).
Moreover, some researchers believe that some ICMEs may have lost their flux rope structure due to interactions in interplanetary space (e.g., Gopalswamy et al. 2001; Liu et al. 2014; Manchester et al. 2017). In particular, sometimes multiple ICMEs can merge to form complex ICMEs where their individual characteristics are no longer identifiable (Burlaga et al. 2002). According to Rodkin et al. (2018), about 48% of observed ICMEs are associated with two or more sources; in some cases, complex ICMEs can be associated with multiple CMEs from the same active region (Burlaga et al. 2002). The interaction processes include compression and magnetic reconnection; however, the compression process does not change the overall topology of rope structures (Riley & Crooker 2004; Zhang et al. 2013). Therefore, the rope structures of CMEs are destroyed mainly through magnetic reconnection processes. A CME that was associated with complex (nonMC) ejecta may inherently have complex magnetic field structure at the Sun, as shown in the simulation results of Lynch et al. (2008). Richardson & Cane (2004) favored the view that the reconnection of multiple loop systems may result in CMEs with several complicated magnetic field structures as solar activity increases. This explanation is appropriate for the observation that a fraction of MCs vary with the phase of the solar cycle, that is, about 15% at solar maximum but almost 100% at solar minimum. However, CME source regions cluster to low latitudes at solar minimum and high latitudes at solar maximum (Hundhausen et al. 1984), thus affecting whether CMEs are expected to be crossed more centrally or at the flanks. Recently, Awasthi et al. (2018) reported a nonMC ICME that supports this view. Its pre-eruptive structure consists of multiple-braided flux ropes with different degrees of coherency, and the individual flux-rope branches appear to be connected to each other. Awasthi et al. (2018) excluded that the complex ICME can result from the merging of successive CMEs and the spacecraft they used only made a glancing encounter with an Earth-directed CME. Awasthi et al. (2018) considered that a nonMC event inherently disrupts magnetic fields.
Suprathermal electron strahls in the solar wind come from the Sun and are focused along magnetic field lines (Feldman et al. 1975; Rosenbauer et al. 1977; Pagel et al. 2005). Therefore, observations of CSE strahls within MCs can indicate that the flux rope structures are still connected with the Sun’s magnetic field lines on both ends (Gosling et al. 1995; Larson et al. 1997; Shodhan et al. 2000; Feng et al. 2015, 2019). Counterstreaming suprathermal electrons can also be produced by other mechanisms, for example connection to the Earth’s bowshock (Feldman et al. 1982; Stansberry et al. 1988), interplanetary shocks or corotating interaction regions (CIRs; Gosling et al. 1993; Steinberg et al. 2005; Lavraud et al. 2010), and distribution function depletions near the 90° pitch angle (Gosling et al. 2001, 2002; Skoug et al. 2006). Among these mechanisms, the depletion CSEs are often observed on closed or open field lines within ICMEs, but the depletion CSEs are centered on and roughly symmetric to the 90° pitch angle (Gosling et al. 2002), and can be distinguished from CSE strahls. Shodhan et al. (2000) examined the CSE strahl signatures of 52 MCs detected by a spacecraft near 1 AU and determined that approximately 87.5% of MCs exhibit CSE signatures, revealing that most MCs are still attached to the Sun at both ends at 1 AU. Gosling (1990) and Gosling et al. (1995) proposed explanations for how flux ropes arise in terms of three-dimensional reconnection close to the Sun. They illustrate how the original flux rope reconnects to form a helical field line connected to the Sun at both ends. The closed field lines of flux ropes can gradually open and occasionally disconnect from the corona when closed flux ropes expand from the Sun into the interplanetary space (Gosling et al. 1995). The proposal of Gosling et al. (1995) was confirmed by statistical results of Shodhan et al. (2000), namely most MCs exhibit CSE strahls in parts of their durations, and only 6 of the 52 MCs have no CSE. We therefore want to know whether or not nonMC ICMEs have the same CSE strahl signatures. In this study, CSE signatures from the Advanced Composition Explorer (ACE) from 1998 to 2008 are compared between ICMEs with and without MCs, and we discuss whether the CSE signatures are related to the flux-rope structures.
2. Data
In this study, the 272 eV suprathermal electron pitch-angle distributions (PADs) measured by ACE are used. The electron PADs are obtained from the Solar Wind Electron Proton Alpha Monitor (SWEPAM) with angular and time resolutions of 9° and 64 s respectively (McComas et al. 1998). Here we examined 16 s average magnetic field, 64 s average plasma, 1 h average O7+/O6+ ratio, and mean Fe charge state ⟨Fe⟩ data from 1998 to 2008 measured by ACE and identified 272 ICMEs in total. The ICMEs were identified by the following process: (1) We take the events in previous ICME lists of Jian et al. (2006), Chi et al. (2016), and Richardson & Cane (2004)1 as candidate ICMEs. (2) Some lists also report short-duration (< 10 h) structures as ICMEs. As the origin of these smaller-scale ICMEs and flux ropes are still debated (Feng et al. 2007; Rouillard et al. 2011; Janvier et al. 2014; Feng & Wang 2015; Wang et al. 2019), we excluded them from this study. (3) The high Fe charge states (⟨Fe⟩ ≥ 12) and abnormally high O7+/O6+ ratio (≥1) are the result of flare-related heating in the corona (Lepri & Zurbuchen 2004; Reinard 2005), and therefore they are independently reliable ICME indicators (Feng & Wang 2015). If the candidate ICMEs have high Fe charge states and/or abnormally high O7+/O6+ ratio, they are identified as ICMEs. (4) If the candidate ICMEs have no high Fe charge states and abnormally high O7+/O6+ ratio, we look for the following five characteristics: declining speed (apparent expansion), increasing total magnetic magnitude and helium abundance (He/P > 0.06) (Richardson & Cane 2004), and decreasing proton temperatures and proton densities. If the candidate ICMEs have three or more of the above characteristics they are identified as ICMEs. Given that magnetic flux ropes are special field topologies characterized by bundles of helical magnetic-field lines collectively spiraling around a common axis, the essential observational properties of magnetic flux ropes should be enhanced magnetic field strength and smooth rotations (Feng et al. 2008, 2010), namely, measured enhanced magnetic field strength, the center-enhanced magnetic components, and bipolar curve magnetic components. Therefore, if an ICME was found to have enhanced magnetic field strength, both center-enhanced and bipolar field components, it was identified as MC. Among the 272 ICMEs, 101 (37.1%) events were identified as MCs. All 272 ICMEs are listed in Table A.1. The second and third columns show the start and end times, the fourth column gives the duration of the ICMEs, and the fifth column provides the types of ICMEs (MC or nonMC).
3. Observations and results
This study analyzed the 272 eV suprathermal electron PADs to determine the CSE signatures within ICMEs. The CSE events were confirmed through their suprathermal electron PADs that show significantly higher phase space densities near 0° and 180° pitch angle directions than in the 90° pitch angle direction (Lavraud et al. 2010). If the ratios of phase space densities near 0° and 180° to the phase space densities at 90° in an interval are greater than three, the interval was noted as a possible CSE interval. We then removed depletion CSEs on open field lines by eye using their symmetries. Finally, the phase space densities at 90° can obviously strengthen by scattering of strahl electrons. For some intervals within ICMEs, the ratios of phase space densities near 0° and 180° to the phase space densities at 90° are less than three, but the CSE strahls can still be recognized by eye; we also noted these intervals as CSE strahls. Counterstreaming suprathermal electron boundaries are not always recognizable, and therefore the identification of CSE intervals within ICMEs is somewhat subjective (Shodhan et al. 2000). We used the ICME in October 21–22, 1999, as an example to illustrate the process of identifying a CSE interval.
Figure 1 shows the suprathermal electron PADs, magnetic and plasma data from the ICME passage of October 21–22, 1999. The two vertical-dashed lines represent the front and rear boundaries of the ICME. This ICME exhibits high Fe charge states (⟨Fe⟩ ≥ 12), an abnormally high O7+/O6+ ratio (≥1), and high He/P(> 0.06) in the rear part. In addition, the event also shows the ICME characteristics of enhanced magnetic magnitude, and decreased proton temperatures and proton densities. The 272 eV suprathermal electron PADs showed that (1) the enhanced phase-space densities near the 180° direction occurred throughout the duration of the ICME; (2) the 0° suprathermal electron strahls are mainly present in the rear half. The red bars above the suprathermal electron PADs mark the intervals where the ratios of phase space densities near 0° and 180° to the phase space densities at 90° are greater than three. It is easy to see that strong depletions occur within the first bar, and the depletion CSE interval was removed when we estimated the percentages of CSEs. One can also see that the bars in the rear half have two short intervals, which are caused by scattering of strahl electrons. We therefore identify the two short intervals as CSE strahls, and the percentage of CSE strahls is about 35%.
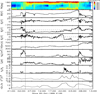 |
Fig. 1. Suprathermal electron pitch angle distributions of 272 eV, magnetic field and plasma data measured by ACE during the October 21C22, 1999 ICME passage. The two vertical dashed lines denote the boundaries of the ICME. |
Furthermore, this study examined all the suprathermal electron PADs of the 272 ICMEs and estimated the percentages of CSEs. The results are listed in the sixth column of Table A.1. Only 10 (9.9%) of the 101 MCs have no CSE, and the ratio is consistent with the results of Shodhan et al. (2000), who examined the CSE signatures of 52 MCs and concluded that 6 MCs have no CSEs. As for the other 91 MCs, the percentage of CSEs varies from 6 to 100%, with a mean value of 57%. Meanwhile, 75 of the 171 nonMC ICMEs (43.9%) do not contain CSEs. The fraction of ICMEs without CSEs is thus clearly larger in nonMC ICMEs than in MCs. The extensive difference may imply that the two groups have different magnetic structures. For the other 96 nonMC events, their mean CSE percentage is 45%, which is smaller than for the MCs (57%). Among the 96 nonMC ICMEs, 21 have greater than 70% CSEs. Examination of the magnetic field component curves of these 21 ICMEs reveals that fields of most events have neither apparent smooth rotations nor disorder, but their magnetic field component curves have only slight rotations, and they are relatively stable or even close to the line. It is well known that most MCs can be described with a constant force-free field configuration, for example, the Lundquist solution (Lepping et al. 1990; Feng et al. 2006). According to the Lundquist solution, the shapes of measured field component curves depend on the distance d0 between the spacecraft trajectory and the rope axis (see Figs. 2–4 of Feng et al. 2006). The spacecraft will measure center-enhanced and bipolar curves if the spacecraft trajectory is close to the rope axis; otherwise, the bipolar curves will disappear. Figure 2 shows the variations of the magnetic field components for the case of d0 = 0.9R0, where R0 is the radius of the flux rope, z is the axial direction, x is the radial direction pointing to the satellite contact position, and the direction y is obtained from the cross product of z and x. In Fig. 2, all the three magnetic field components are relatively stable and exhibit only slight rotations. These trends indicate that the spacecraft that passes through the flank of a magnetic flux rope will measure relatively stable magnetic field variations. Therefore, the 21 highest percentage (more than 70%) events may have flux rope structures, but the spacecraft crosses the flanks of the ropes and thus the flux rope signatures do not appear. For example, Fig. 3 shows that the ICME on February 18–19, 2005, has a CSE percentage of 100%. Based on Fig. 3, one can find that all three magnetic field component curves remain stable with little fluctuation; in particular, the z component curve is around zero. Meanwhile, the magnetic field magnitude remains at a low value. This event does not satisfy the requirements of MCs (flux ropes). Kim et al. (2013) investigated the propagation characteristics of this ICME and used the direction parameter (D) to quantify the asymmetry of CME shapes in coronagraph images and the degree of deviation from the Sun–Earth line. The value of D is between 0 and 1, and a small D indicates a large deviation from the Sun–Earth line. For this ICME, the D value is only 0.13, indicating that its propagation direction is essentially deviated from the Sun–Earth line. Thus, Kim et al. (2013) considered that this CME inherently has a magnetic flux rope structure even though the ACE spacecraft crossed the flank of the rope and did not measure the essential properties of the magnetic flux rope. For this ICME, we have the same viewpoint with Kim et al. (2013). Figure 2 demonstrates that the spacecraft that passes through the flank of the magnetic flux ropes will measure relatively stable magnetic field variations. The MC legs, which magnetically connect the flux rope to the Sun, are not recognizable as MCs and thus are unlikely to contain twisted flux rope fields. Spacecraft encounters with these nonflux-rope legs may provide an explanation for the frequent observation of nonMC ICMEs. It is also possible that the spacecraft passes through the legs of the flux rope where the flux-rope-like rotation is not observed but other flux rope signatures are present (Owens 2016). We therefore conclude that most of the 21 ICMEs with large CSE percentages may inherently have flux rope structures, but the structures do not appear as MCs because of geometric selection effects. Finally, we can draw such a conclusion that only a few MCs do not exhibit CSE signatures, but about half of the nonMC ICMEs do not exhibit CSE signatures.
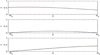 |
Fig. 2. Variation of normalized magnetic field components for the case of d0 = 0.9R0, where R0 is radius of the flux rope and d0 is the distance between the spacecraft trajectory and the rope axis. |
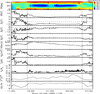 |
Fig. 3. Suprathermal electron pitch angle distributions of 272 eV magnetic field and plasma data measured by ACE during the ICME passage of February 18–19, 2005. |
4. Discussion and summary
In this study, we examined the CSE signatures of the 272 ICMEs detected by ACE from 1998 to 2008 and compared them between ICMEs with and without MC (flux rope) structure. Our study confirms the earlier results, for example those by Shodhan et al. (2000), that the overwhelming majority of MCs are still connected to the solar magnetic field on both ends for at least part of their magnetic field lines near 1 AU. The fact that the clear majority of MCs exhibit CSEs suggests that the nonMC population featuring CSEs could also have flux rope structure. We find that the MC category had 101 events with only 10 (9.9%) events having no CSEs, and that the nonMC category had 171 events with 75 (43.9%) events having no CSEs. The fraction of nonMC events without CSE is distinctly larger than that for the MC events. The highest-percentage (more than 70%) events in the nonMC category usually have stable magnetic field components accompanied with slight rotations based on our visual evaluation. These observations are in line with the expectations that observing spacecraft pass through the flank of magnetic flux ropes. The results of this study imply that some nonMC events indeed have magnetic flux rope structures. In most nonMC events, magnetic fields are disordered, and most field lines are not connected to the Sun at both ends. As in the CMEs reported by Awasthi et al. (2018), these nonMC events may inherently have disordered magnetic fields, which results from the interactions among multiple-braided flux ropes with different degrees of coherency on the Sun. In summary, this study provides information that is helpful in checking whether all ICMEs have flux rope structures. The observations in this study do not support the idea that all CMEs that arrive on Earth have flux ropes but suggests that some nonMC events indeed have magnetic flux rope structures. However, we cannot exclude the possibility that all CMEs that arrive at Earth had a flux rope structure when they were launched from the Sun. The association of the CSE signatures and the CME structures is an interesting problem and could be investigated in the future.
Acknowledgments
The authors acknowledge supports from NSFC under grant Nos. 41804162, 41674170, 41974197. The authors thank NASA/GSFC for the use of data from ACE, these data can obtain freely from the Coordinated Data Analysis Web (http://cdaweb.gsfc.nasa.gov/cdaweb/istp_public/).
References
- Awasthi, A. K., Liu, R., Wang, H., et al. 2018, ApJ, 857, 124 [NASA ADS] [CrossRef] [Google Scholar]
- Burlaga, L., Sittler, E., Mariani, F., & Schwenn, R. 1981, J. Geophys. Res., 86, 6673 [Google Scholar]
- Burlaga, L. F., Skoug, R. M., Smith, C. W., et al. 2001, J. Geophys. Res., 106, 20957 [NASA ADS] [CrossRef] [Google Scholar]
- Burlaga, L. F., Plunkett, S. P., & St Cyr, O. C. 2002, J. Geophys. Res. (Space Physics), 107, 1266 [NASA ADS] [CrossRef] [Google Scholar]
- Cane, H. V., & Richardson, I. G. 2003, J. Geophys. Res. (Space Physics), 108, 1156 [Google Scholar]
- Cane, H. V., Richardson, I. G., & Wibberenz, G. 1997, J. Geophys. Res., 102, 7075 [NASA ADS] [CrossRef] [Google Scholar]
- Canfield, R. C., Hudson, H. S., & McKenzie, D. E. 1999, Geophys. Res. Lett., 26, 627 [Google Scholar]
- Chi, Y., Shen, C., Wang, Y., et al. 2016, Sol. Phys., 291, 2419 [NASA ADS] [CrossRef] [Google Scholar]
- Feng, H. Q., & Wang, J. M. 2015, ApJ, 809, 112 [NASA ADS] [CrossRef] [Google Scholar]
- Feng, H. Q., Wu, D. J., & Chao, J. K. 2006, J. Geophys. Res. (Space Physics), 111, A07S90 [CrossRef] [Google Scholar]
- Feng, H. Q., Wu, D. J., & Chao, J. K. 2007, J. Geophys. Res. (Space Physics), 112, A02102 [NASA ADS] [CrossRef] [Google Scholar]
- Feng, H. Q., Wu, D. J., Lin, C. C., et al. 2008, J. Geophys. Res. (Space Physics), 113, A12105 [NASA ADS] [CrossRef] [Google Scholar]
- Feng, H. Q., Wu, D. J., & Chao, J. K. 2010, J. Geophys. Res. (Space Physics), 115, A10109 [NASA ADS] [CrossRef] [Google Scholar]
- Feng, H. Q., Zhao, G. Q., & Wang, J. M. 2015, J. Geophys. Res. (Space Physics), 120, 10 [Google Scholar]
- Feng, H. Q., Zhao, G. Q., & Wang, J. M. 2019, Sci. China Technol. Sci., 1 [Google Scholar]
- Feldman, W. C., Asbridge, J. R., Bame, S. J., et al. 1975, J. Geophys. Res., 80, 4181 [NASA ADS] [CrossRef] [Google Scholar]
- Feldman, W. C., Anderson, R. C., Asbridge, J. R., et al. 1982, J. Geophys. Res., 87, 632 [NASA ADS] [CrossRef] [Google Scholar]
- Gopalswamy, N., Yashiro, S., Kaiser, M. L., et al. 2001, ApJ, 548, L91 [Google Scholar]
- Gopalswamy, N., Nieves-Chinchilla, T., Hidalgo, M., et al. 2013a, Sol. Phys., 284, 1 [NASA ADS] [CrossRef] [Google Scholar]
- Gopalswamy, N., Mäkelä, P., Akiyama, S., et al. 2013b, Sol. Phys., 284, 17 [NASA ADS] [CrossRef] [Google Scholar]
- Gosling, J. T. 1990, Geophys. Union Geophys. Monograph Ser., 58, 343 [NASA ADS] [Google Scholar]
- Gosling, J. T., Baker, D. N., Bame, S. J., et al. 1987, J. Geophys. Res., 92, 8519 [Google Scholar]
- Gosling, J. T., Bame, S. J., Feldman, W. C., et al. 1993, Geophys. Res. Lett., 20, 2335 [NASA ADS] [CrossRef] [Google Scholar]
- Gosling, J. T., Birn, J., & Hesse, M. 1995, Geophys. Res. Lett., 22, 869 [NASA ADS] [CrossRef] [Google Scholar]
- Gosling, J. T., Skoug, R. M., & Feldman, W. C. 2001, Geophys. Res. Lett., 28, 4155 [NASA ADS] [CrossRef] [Google Scholar]
- Gosling, J. T., Skoug, R. M., Feldman, W. C., et al. 2002, Geophys. Res. Lett., 29, 1573 [NASA ADS] [CrossRef] [Google Scholar]
- Hirshberg, J., Bame, S. J., & Robbins, D. E. 1972, Sol. Phys., 23, 467 [NASA ADS] [CrossRef] [Google Scholar]
- Hundhausen, A. J., Sawyer, C. B., House, L., Illing, R. M. E., & Wagner, W. J. 1984, J. Geophys. Res., 89, 2639 [NASA ADS] [CrossRef] [Google Scholar]
- Huttunen, K. E. J., Koskinen, H. E. J., & Schwenn, R. 2002, J. Geophys. Res. (Space Physics), 107, 1121 [NASA ADS] [CrossRef] [Google Scholar]
- Janvier, M., Démoulin, P., & Dasso, S. 2014, J. Geophys. Res. (Space Physics), 119, 7088 [NASA ADS] [CrossRef] [Google Scholar]
- Jian, L., Russell, C. T., Luhmann, J. G., et al. 2006, Sol. Phys., 239, 393 [NASA ADS] [CrossRef] [Google Scholar]
- Kilpua, E. K. J., Jian, L. K., Li, Y., Luhmann, J. G., & Russell, C. T. 2011, J. Atmos. Sol. Terrest. Phys., 73, 1228 [Google Scholar]
- Kilpua, E., Koskinen, H. E. J., & Pulkkinen, T. I. 2017, Liv. Rev. Sol. Phys., 14, 5 [NASA ADS] [CrossRef] [Google Scholar]
- Kim, R.-S., Gopalswamy, N., Cho, K.-S., et al. 2013, Sol. Phys., 284, 77 [NASA ADS] [CrossRef] [Google Scholar]
- Larson, D. E., Lin, R. P., McTiernan, J. M., et al. 1997, Geophys. Res. Lett., 24, 1911 [NASA ADS] [CrossRef] [Google Scholar]
- Lavraud, B., Opitz, A., Gosling, J. T., et al. 2010, Ann. Geophys., 28, 233 [NASA ADS] [CrossRef] [Google Scholar]
- Lepping, R. P., Burlaga, L. F., & Jones, J. A. 1990, J. Geophys. Res., 95, 11957 [NASA ADS] [CrossRef] [Google Scholar]
- Lepri, S. T., & Zurbuchen, T. H. 2004, J. Geophys. Res. (Space Physics), 109, A01112 [NASA ADS] [Google Scholar]
- Lepri, S. T., Zurbuchen, T. H., Fisk, L. A., et al. 2001, J. Geophys. Res., 106, 29231 [NASA ADS] [CrossRef] [Google Scholar]
- Liu, R., Liu, C., Wang, S., et al. 2010, ApJ, 725, L84 [NASA ADS] [CrossRef] [Google Scholar]
- Liu, Y. D., Yang, Z., Wang, R., et al. 2014, ApJ, 793, L41 [NASA ADS] [CrossRef] [Google Scholar]
- Lynch, B. J., Antiochos, S. K., DeVore, C. R., et al. 2008, ApJ, 683, 1192 [NASA ADS] [CrossRef] [Google Scholar]
- Mäkelä, P., Gopalswamy, N., Xie, H., et al. 2013, Sol. Phys., 284, 59 [NASA ADS] [CrossRef] [Google Scholar]
- Manchester, W., Kilpua, E. K. J., Liu, Y. D., et al. 2017, Space Sci. Res., 212, 1159 [Google Scholar]
- McComas, D. J., Bame, S. J., Barker, P., et al. 1998, Space Sci. Res., 86, 563 [Google Scholar]
- Owens, M. J. 2016, ApJ, 818, 197 [NASA ADS] [CrossRef] [Google Scholar]
- Pagel, C., Crooker, N. U., Larson, D. E., et al. 2005, J. Geophys. Res. (Space Physics), 110, A01103 [Google Scholar]
- Reinard, A. 2005, ApJ, 620, 501 [NASA ADS] [CrossRef] [Google Scholar]
- Richardson, I. G., & Cane, H. V. 2004, J. Geophys. Res. (Space Physics), 109, A09104 [NASA ADS] [CrossRef] [Google Scholar]
- Riley, P., & Crooker, N. U. 2004, ApJ, 600, 1035 [Google Scholar]
- Rodkin, D., Slemzin, V., Zhukov, A. N., et al. 2018, Sol. Phys., 293, 78 [NASA ADS] [CrossRef] [Google Scholar]
- Rouillard, A. P., Sheeley, Jr., N. R., Cooper, T. J., et al. 2011, ApJ, 734, 7 [Google Scholar]
- Rosenbauer, H., Schwenn, R., Marsch, E., et al. 1977, J. Geophys. Z. Geophys., 42, 561 [Google Scholar]
- Rust, D. M., & Kumar, A. 1996, ApJ, 464, L199 [NASA ADS] [CrossRef] [Google Scholar]
- Shodhan, S., Crooker, N. U., Kahler, S. W., et al. 2000, J. Geophys. Res., 105, 27261 [Google Scholar]
- Skoug, R. M., Gosling, J. T., McComas, D. J., et al. 2006, J. Geophys. Res. (Space Physics), 111, A01101 [NASA ADS] [CrossRef] [Google Scholar]
- Stansberry, J. A., Gosling, J. T., Thomsen, M. F., et al. 1988, J. Geophys. Res., 93, 1975 [NASA ADS] [CrossRef] [Google Scholar]
- Steinberg, J. T., Gosling, J. T., Skoug, R. M., et al. 2005, J. Geophys. Res. (Space Physics), 110, A06103 [NASA ADS] [CrossRef] [Google Scholar]
- Wang, J. M., & Feng, H. Q. 2016, Sci. China Earth Sci., 59, 1051 [NASA ADS] [CrossRef] [Google Scholar]
- Wang, J. M., Feng, H. Q., Li, H. B., et al. 2019, ApJ, 876, 57 [NASA ADS] [CrossRef] [Google Scholar]
- Webb, D. F., Cliver, E. W., Crooker, N. U., et al. 2000, J. Geophys. Res., 105, 7491 [Google Scholar]
- Yashiro, S., Gopalswamy, N., Mäkelä, P., et al. 2013, Sol. Phys., 284, 5 [NASA ADS] [CrossRef] [Google Scholar]
- Zhang, J., Richardson, I. G., Webb, D. F., et al. 2007, J. Geophys. Res. (Space Physics), 112, A10102 [NASA ADS] [CrossRef] [Google Scholar]
- Zhang, J., Hess, P., & Poomvises, W. 2013, Sol. Phys., 284, 89 [NASA ADS] [CrossRef] [Google Scholar]
- Zwickl, R. D., Asbridge, J. R., Bame, S. J., et al. 1982, J. Geophys. Res., 87, 7379 [NASA ADS] [CrossRef] [Google Scholar]
Appendix A: Table
Percentage of counterstreaming suprathermal electrons in ICMEs.
All Tables
All Figures
|
Fig. 1. Suprathermal electron pitch angle distributions of 272 eV, magnetic field and plasma data measured by ACE during the October 21C22, 1999 ICME passage. The two vertical dashed lines denote the boundaries of the ICME. |
| In the text | |
|
Fig. 2. Variation of normalized magnetic field components for the case of d0 = 0.9R0, where R0 is radius of the flux rope and d0 is the distance between the spacecraft trajectory and the rope axis. |
| In the text | |
|
Fig. 3. Suprathermal electron pitch angle distributions of 272 eV magnetic field and plasma data measured by ACE during the ICME passage of February 18–19, 2005. |
| In the text | |
Current usage metrics show cumulative count of Article Views (full-text article views including HTML views, PDF and ePub downloads, according to the available data) and Abstracts Views on Vision4Press platform.
Data correspond to usage on the plateform after 2015. The current usage metrics is available 48-96 hours after online publication and is updated daily on week days.
Initial download of the metrics may take a while.