Free Access
Fig. 5.
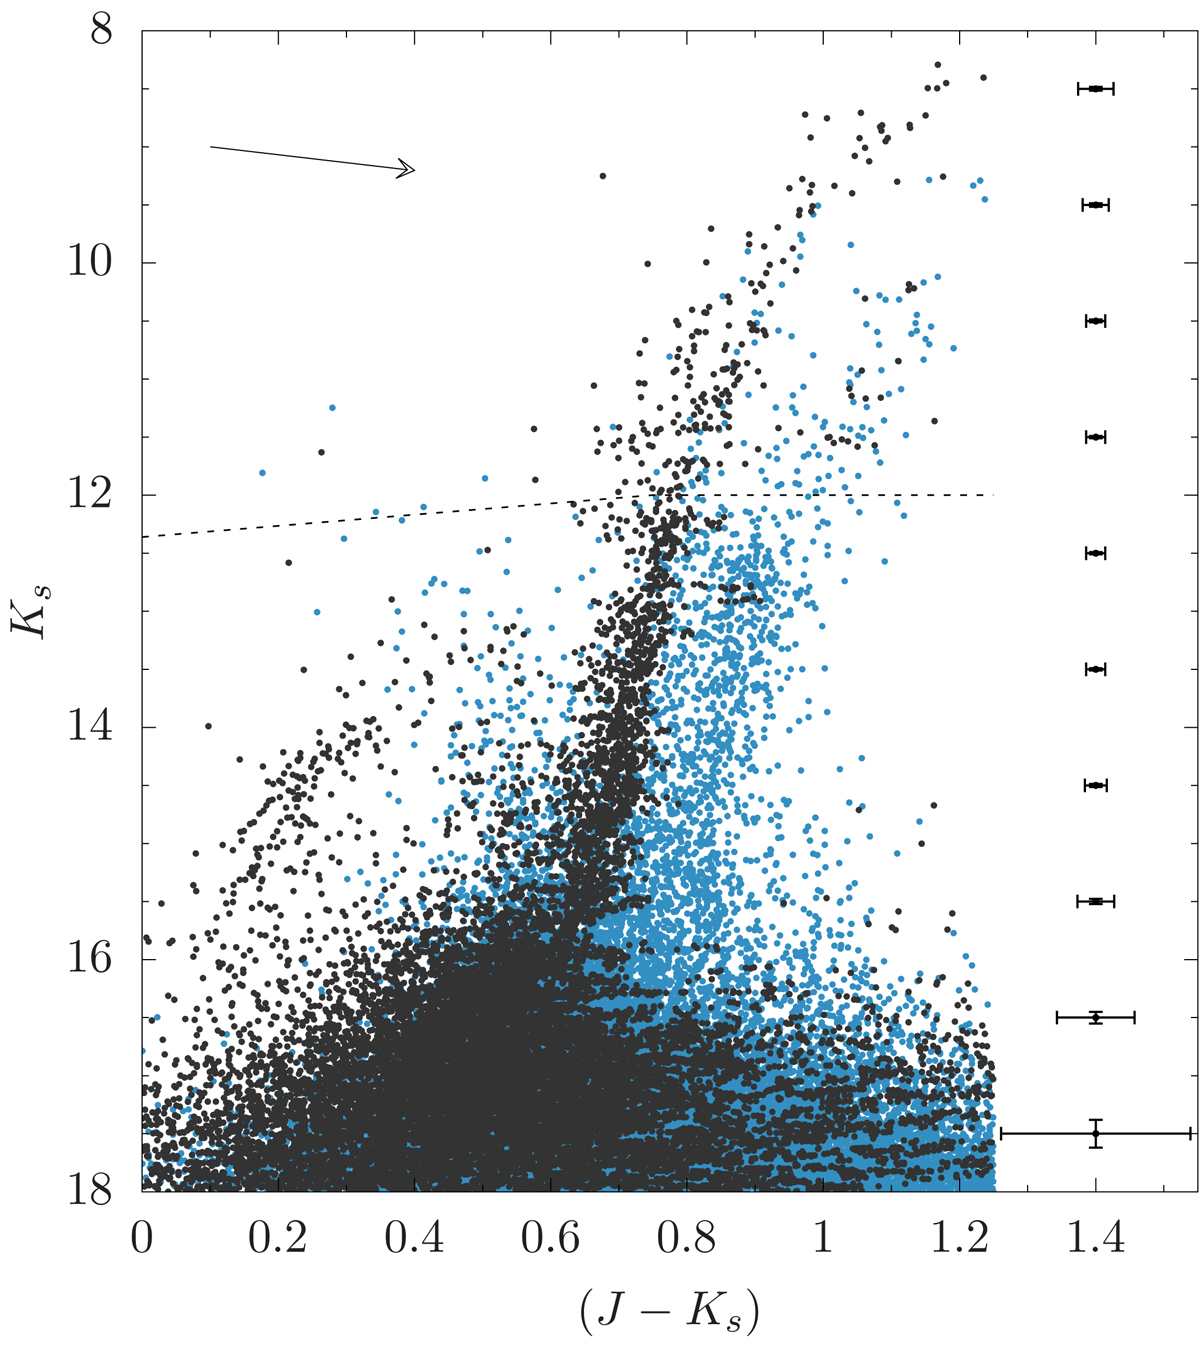
Original (blue dots) and decontaminated (black dots) CMD of the cluster area (r < 4′). The arrow and the error bars are as in Fig. 3. The dotted line shows the saturation limit in VVV frames.
Current usage metrics show cumulative count of Article Views (full-text article views including HTML views, PDF and ePub downloads, according to the available data) and Abstracts Views on Vision4Press platform.
Data correspond to usage on the plateform after 2015. The current usage metrics is available 48-96 hours after online publication and is updated daily on week days.
Initial download of the metrics may take a while.