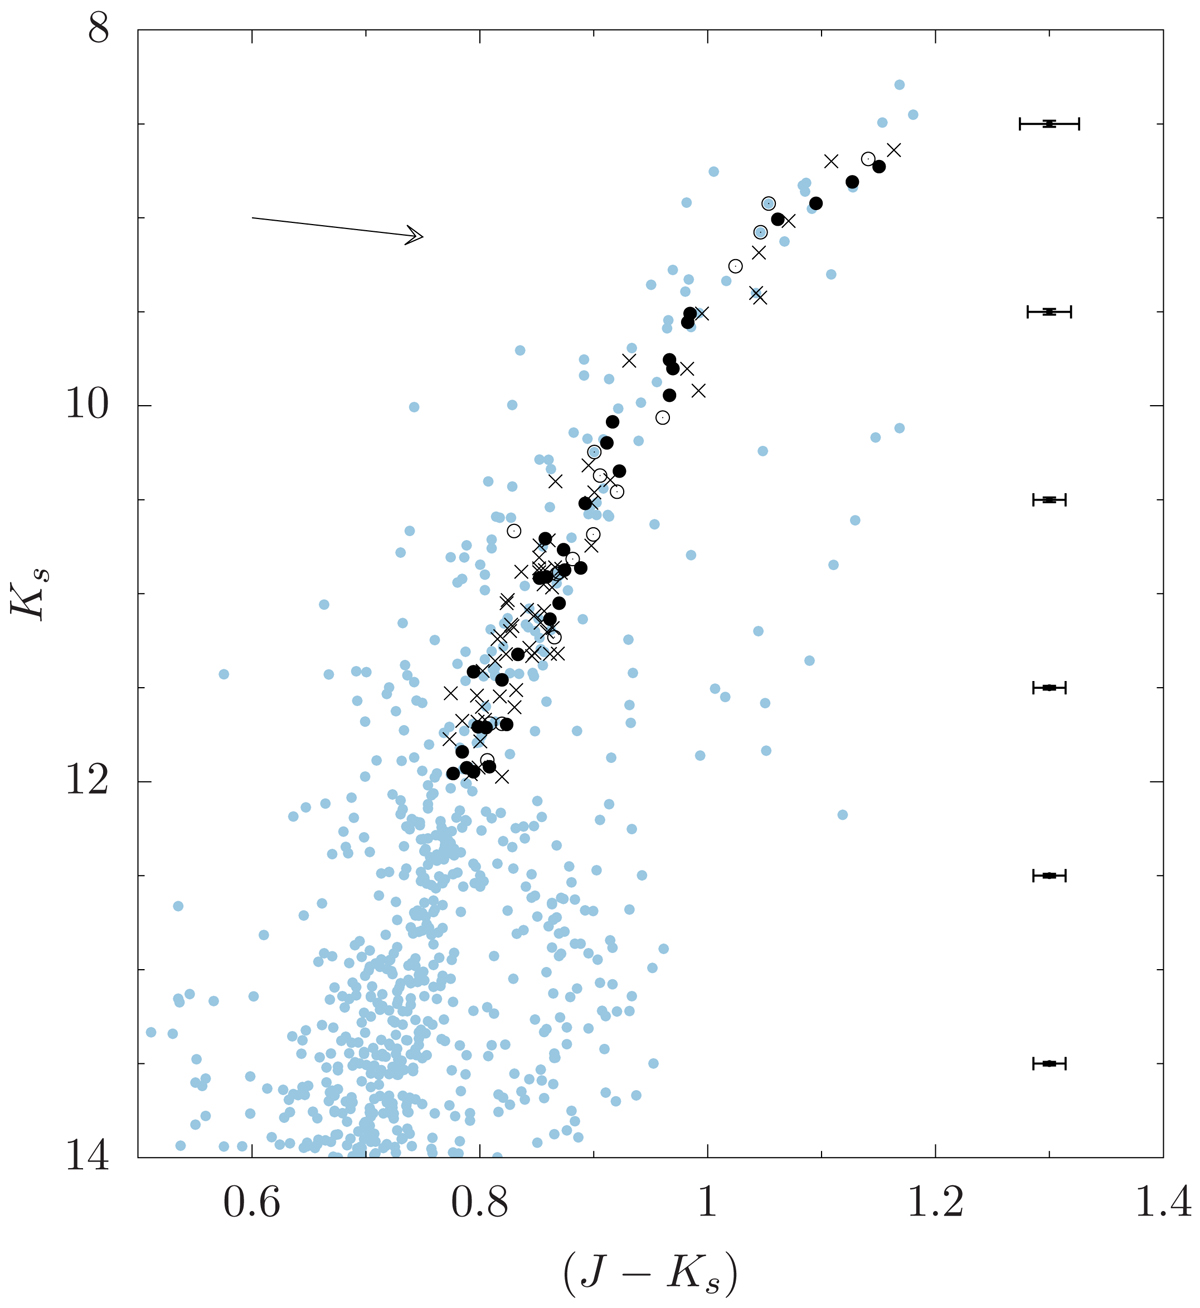
Fig. 3.

Position of the spectroscopic targets in the VVV colour-magnitude diagram. The sources detected within 2′ of the cluster centre are overplotted in light blue. Solid dots, open symbols, and crosses indicate the stars classified as cluster members, additional member candidates, and field stars, respectively. Average errors as a function of magnitudes are plotted on the right, and the arrow shows the direction of interstellar reddening.
Current usage metrics show cumulative count of Article Views (full-text article views including HTML views, PDF and ePub downloads, according to the available data) and Abstracts Views on Vision4Press platform.
Data correspond to usage on the plateform after 2015. The current usage metrics is available 48-96 hours after online publication and is updated daily on week days.
Initial download of the metrics may take a while.


