Free Access
Fig. 2.
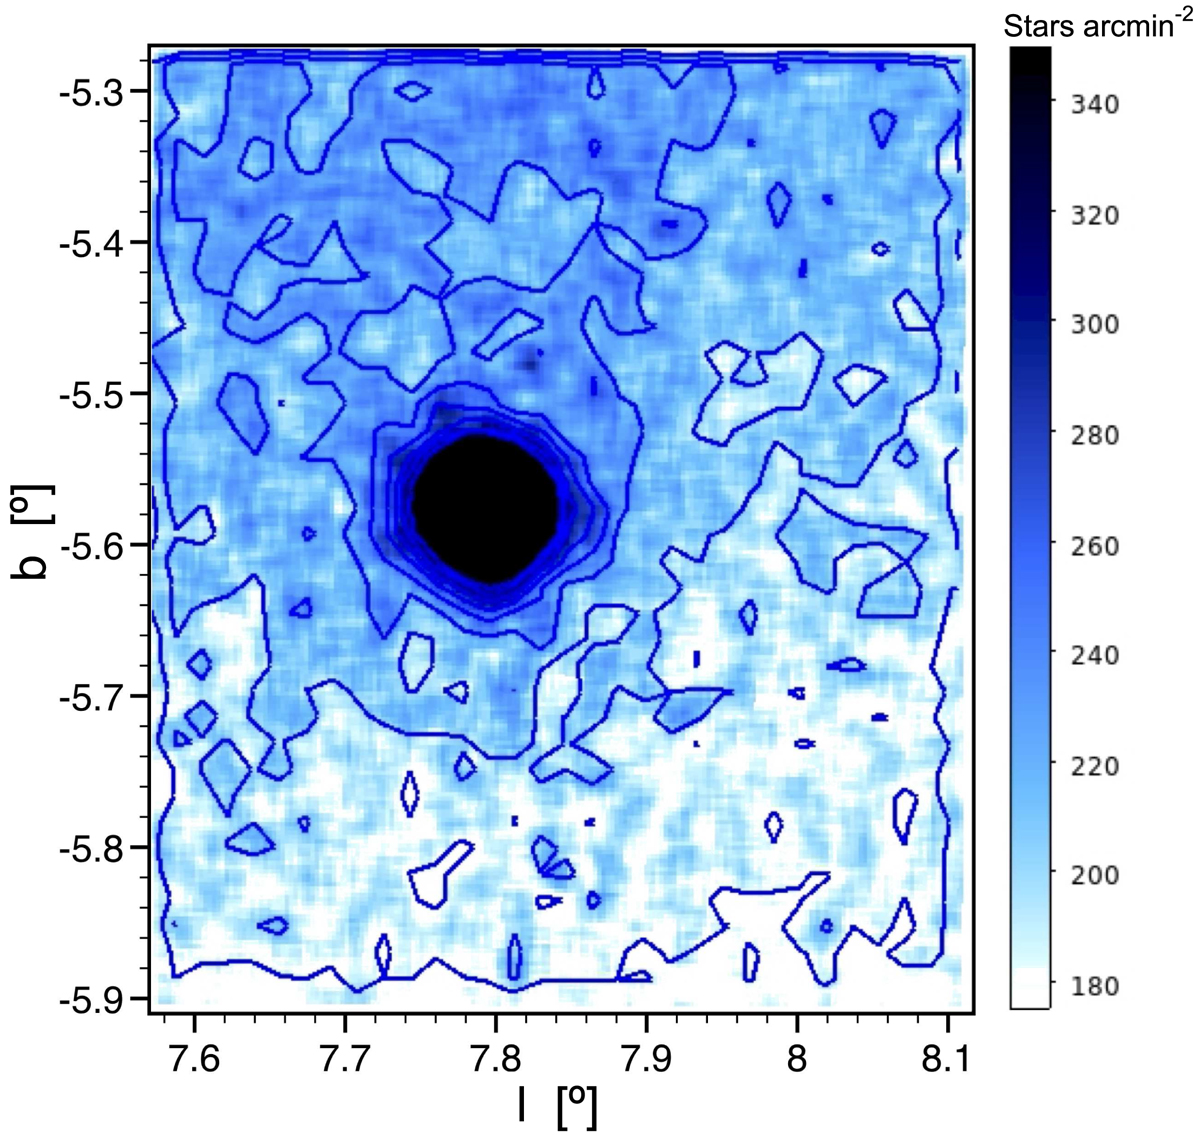
Density map of the sources with Ks < 17.5 detected in the VVV frames. The density values in the blue-scale bar are in units of sources per arcmin2. The contour levels are shown at steps of 25 sources arcmin−2 from the minimum average background.
Current usage metrics show cumulative count of Article Views (full-text article views including HTML views, PDF and ePub downloads, according to the available data) and Abstracts Views on Vision4Press platform.
Data correspond to usage on the plateform after 2015. The current usage metrics is available 48-96 hours after online publication and is updated daily on week days.
Initial download of the metrics may take a while.