Fig. 17.
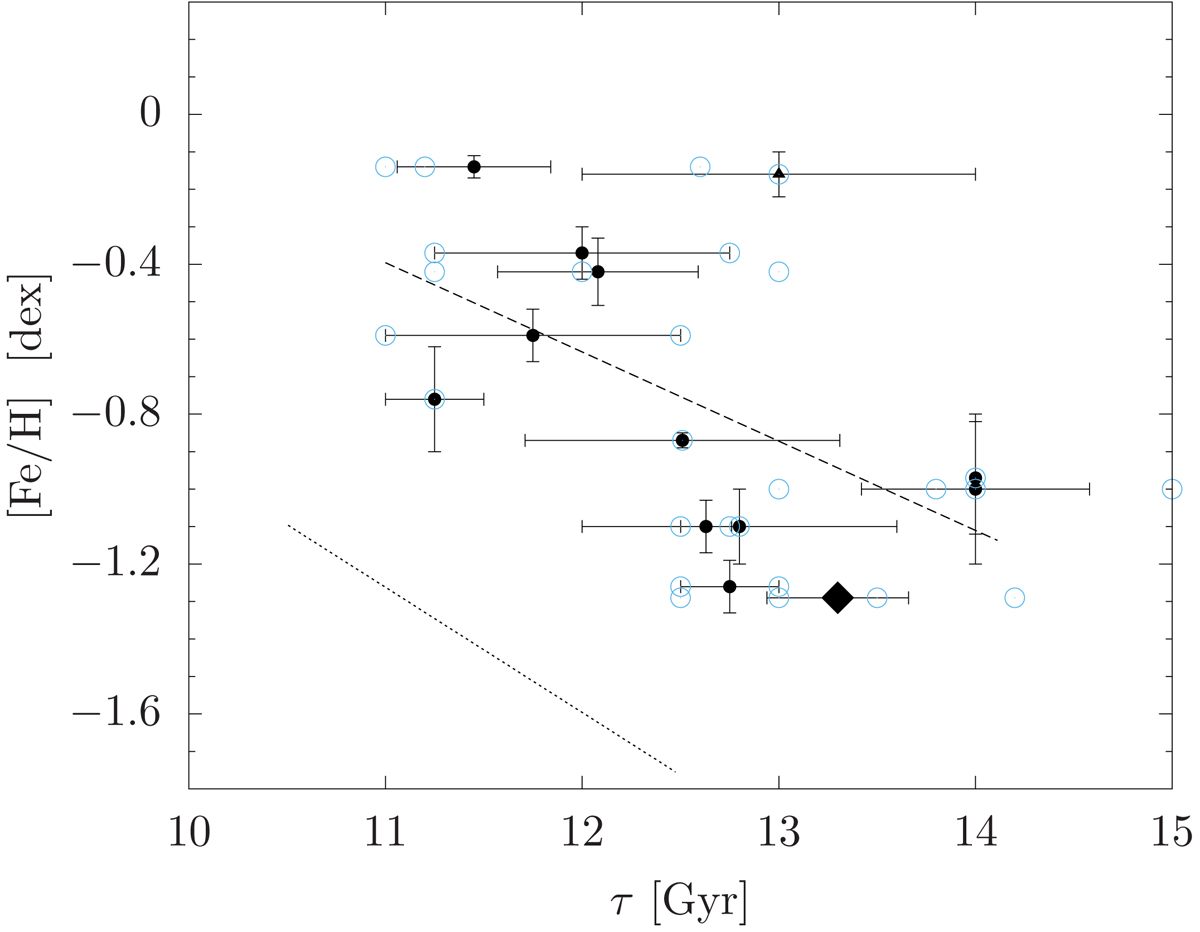
Age-metallicity relation of bulge clusters. The dashed line indicates the linear fit of the data, while the dotted line shows a similar relation for halo objects. Empty light blue dots are used for the single literature measurements, while full black dots show the average value for each cluster. The outlier NGC 6553 is shown as a triangle, while M 28 is shown as a larger diamond.
Current usage metrics show cumulative count of Article Views (full-text article views including HTML views, PDF and ePub downloads, according to the available data) and Abstracts Views on Vision4Press platform.
Data correspond to usage on the plateform after 2015. The current usage metrics is available 48-96 hours after online publication and is updated daily on week days.
Initial download of the metrics may take a while.