Free Access
Fig. 14.
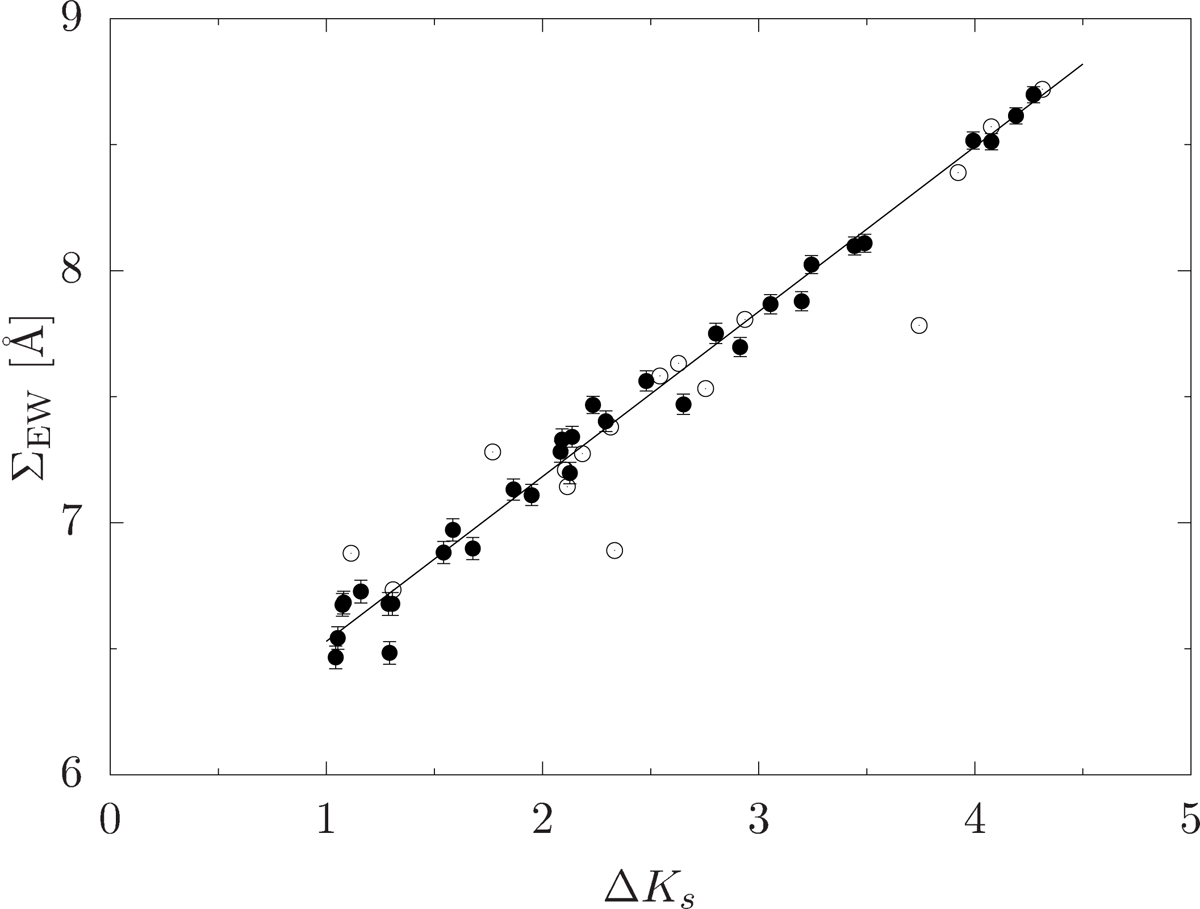
Sum of the EW of the three CaT lines (ΣEW) of target stars, as a function of their magnitude difference with respect to the HB level (ΔKs). Full and empty dots are used for the cluster members and the additional possible cluster members, respectively. The line shows the linear fit of the cluster members.
Current usage metrics show cumulative count of Article Views (full-text article views including HTML views, PDF and ePub downloads, according to the available data) and Abstracts Views on Vision4Press platform.
Data correspond to usage on the plateform after 2015. The current usage metrics is available 48-96 hours after online publication and is updated daily on week days.
Initial download of the metrics may take a while.